Introduction
Anterior shoulder dislocation is more common in younger individuals and, according to population-based emergency-department data, occurs more frequently in men.[1][10] After a first traumatic episode, recurrence remains common and is also closely related to age and sex.[2] These demographic patterns occur alongside soft-tissue injury, bone loss, and variation in glenohumeral geometry. The glenoid-track framework further emphasizes that glenoid and humeral-head bone loss interact, rather than acting as separate lesions.[11]
Imaging studies have examined glenoid size, shape, inclination, version, concavity, and the relationship between glenoid and humeral-head dimensions, and their findings have not been consistent. Peltz et al. observed flatter glenoids, lower anterior–posterior conformity and stability angles, and a higher glenoid height-to-width ratio in instability cases, with no significant differences in absolute glenoid height, width, version, or humeral-head radius of curvature.[3] Hohmann and Tetsworth noted less retroversion and greater inferior inclination in patients who had previously suffered an anterior dislocation.[4] Kıvrak and Ulusoy found differences in glenoid width, height-to-width ratio, version, depth, radii of curvature, and the bony shoulder stability ratio, although height and inclination were similar between groups.[5] In individuals younger than 21 years, Cohn et al. found no overall differences in the individual glenoid or humeral-head dimensions, although the instability group had a higher glenohumeral mismatch ratio, and male patients with instability had smaller glenoid width and surface area.[6] A separate CT comparison likewise found differences in glenoid height and width.[7] Biomechanical research shows that concavity depth and radius are the primary determinants of translational stability, with joint incongruence having a negligible effect, supporting the assessment of geometry beyond simple linear dimensions.[12]
This study evaluated nine MRI-recorded glenoid and humeral-head measurements in an unmatched case-control dataset. Its aim was to describe differences between the groups and estimate associations with a documented history of anterior instability after accounting for age, sex, and shoulder side. The analysis was not intended to predict future outcomes. Furthermore, because the MRI in cases was obtained after instability had already occurred, the recorded measurements could reflect native anatomy, acquired change, or a combination of both.
Materials and Methods
Study Design and Setting
This was a retrospective, unmatched case-control study of 200 Middle Eastern shoulders, drawn from patients who underwent primary rotator cuff repair following a preoperative shoulder MRI between January 2021 and January 2026. The study was carried out at the Department of Orthopedic Surgery of St. George's University Medical Center in Beirut.
Ethics: [AUTHOR CONFIRMATION REQUIRED: ethics committee, approval number and date, and informed-consent waiver or consent statement.]
Source Population and Eligibility
Middle Eastern origin was determined from self-reported demographic and nationality data recorded in the institutional electronic medical record (EMR) system at the time of registration. Eligible patients were Lebanese or of another Middle Eastern nationality; patients of non-Middle Eastern nationality were excluded. Although the cohort mainly consisted of adult patients, skeletally mature adolescents aged 16 to 17 years who met all diagnostic and imaging criteria were included to reflect the demographic profile of acute shoulder instability presentations seen in clinical practice.
The study employed an unmatched 1:1 retrospective case-control design. First, we sequentially screened a cohort of 115 potential instability cases treated at our institution between January 2021 and January 2026. Fifteen were excluded (six for inadequate MRI, four for non-Middle Eastern origin, and five for previous shoulder surgery), leaving 100 eligible cases. To construct the control group, we sequentially screened a separate pool of 150 consecutive patients who underwent preoperative shoulder MRI for primary rotator cuff repair without clinical instability during the same study period.
Of these 150 potential controls, 50 were excluded: 20 because of inadequate or incomplete MRI, 13 because of non-Middle Eastern origin, and 17 because of previous shoulder surgery. This sequential screening process yielded exactly 100 eligible controls, completing the final analytical cohort of 200 shoulders (100 cases, 100 controls), as shown in Figure 1.
The study used a convenience sample; no a priori sample-size calculation was performed.

Case and Control Definitions
Cases were shoulders with a documented history of anterior instability before the index MRI, while controls were shoulders that underwent MRI with no prior history of dislocation, subluxation, or clinical instability. Case status was coded 1 and control status was coded 0.
Anterior instability was defined as a documented history of either a true anterior glenohumeral dislocation or an anterior shoulder subluxation. To ensure diagnostic reliability and avoid the ambiguity of patient-reported symptoms, these events were identified by directly reviewing physician clinical notes in our institution's electronic medical record (EMR) system. All included cases required a formal diagnosis documented by either an emergency department physician or the evaluating orthopedic surgeon, and shoulders lacking a definitive provider diagnosis in the system notes were excluded from the case cohort. These historical EMR outcomes were verified by two orthopedic surgery residents who were blinded to the patients' MRI measurements. The EMR review and the MRI measurements were carried out by different residents, and the two residents who verified the EMR diagnoses had no role in the MRI morphometric assessment and no access to its results.
The case cohort comprised both traumatic and atraumatic episodes of anterior instability, although the majority were traumatic in origin. Because our primary aim was to assess the skeletal morphology associated with anterior instability broadly rather than to isolate specific injury mechanisms, a separate subgroup analysis comparing traumatic and atraumatic subsets was not performed. Patients with any history or clinical documentation of posterior or multidirectional instability were excluded.
Imaging and Morphometric Measurement
In cases, the index MRI was obtained after the first episode of anterior instability.
All studies were performed on a 3.0-T MRI scanner (GE Healthcare, Chicago, IL, USA) using a standardized musculoskeletal shoulder protocol: native 2D multiplanar acquisition, without reconstructed views, in the axial, coronal oblique (parallel to the supraspinatus tendon), and sagittal oblique (perpendicular to the supraspinatus tendon and parallel to the glenoid face) planes. Routine sequences comprised T1-weighted imaging alongside fat-suppressed T2- or proton-density-weighted imaging (Fat-Sat or STIR), with a standard slice thickness of 3.0 mm and a 0.3 mm interslice gap.
The 200 analyzed shoulders corresponded to 200 unique patients, with one shoulder included per patient. Among patients who had imaging of both shoulders, only the symptomatic shoulder was included, and no patient had bilateral symptoms requiring a secondary selection rule.
Digital morphometric measurements were performed on the index shoulder MRI scans. For each parameter, the image that best displayed the relevant landmarks was selected, and digital calipers or reference lines were positioned accordingly. Linear measurements were recorded in millimetres and angular measurements in degrees, and both glenoid and humeral-head diameters were measured directly.
The nine parameters were glenoid height (the superior-to-inferior distance along the longitudinal glenoid axis on the en-face view); upper and lower glenoid width (anteroposterior distances across the upper and lower portions of the glenoid); glenoid diameter (the greatest anteroposterior bony distance on the en-face view); glenoid inclination β (the angle between the glenoid fossa line and the floor of the supraspinatus fossa on an oblique coronal view); glenoid anteversion α (the angular deviation of the anteroposterior glenoid line from a line perpendicular to the scapular/Friedman axis on an axial view, with higher values indicating greater anteversion); humeral-head height (the perpendicular distance from the anatomical-neck plane to the most prominent articular surface on a coronal view); humeral-head inclination (the angle between the head-neck axis and the humeral shaft axis); and humeral-head diameter (the maximum transverse distance through the centre of the humeral head). These conventions are illustrated schematically in Figure 2.
Glenoid anteversion α was measured using a sign convention in which positive values denote anteversion. All 200 recorded α values were positive (range, 2.1°–18.1°), representing glenoid anteversion.
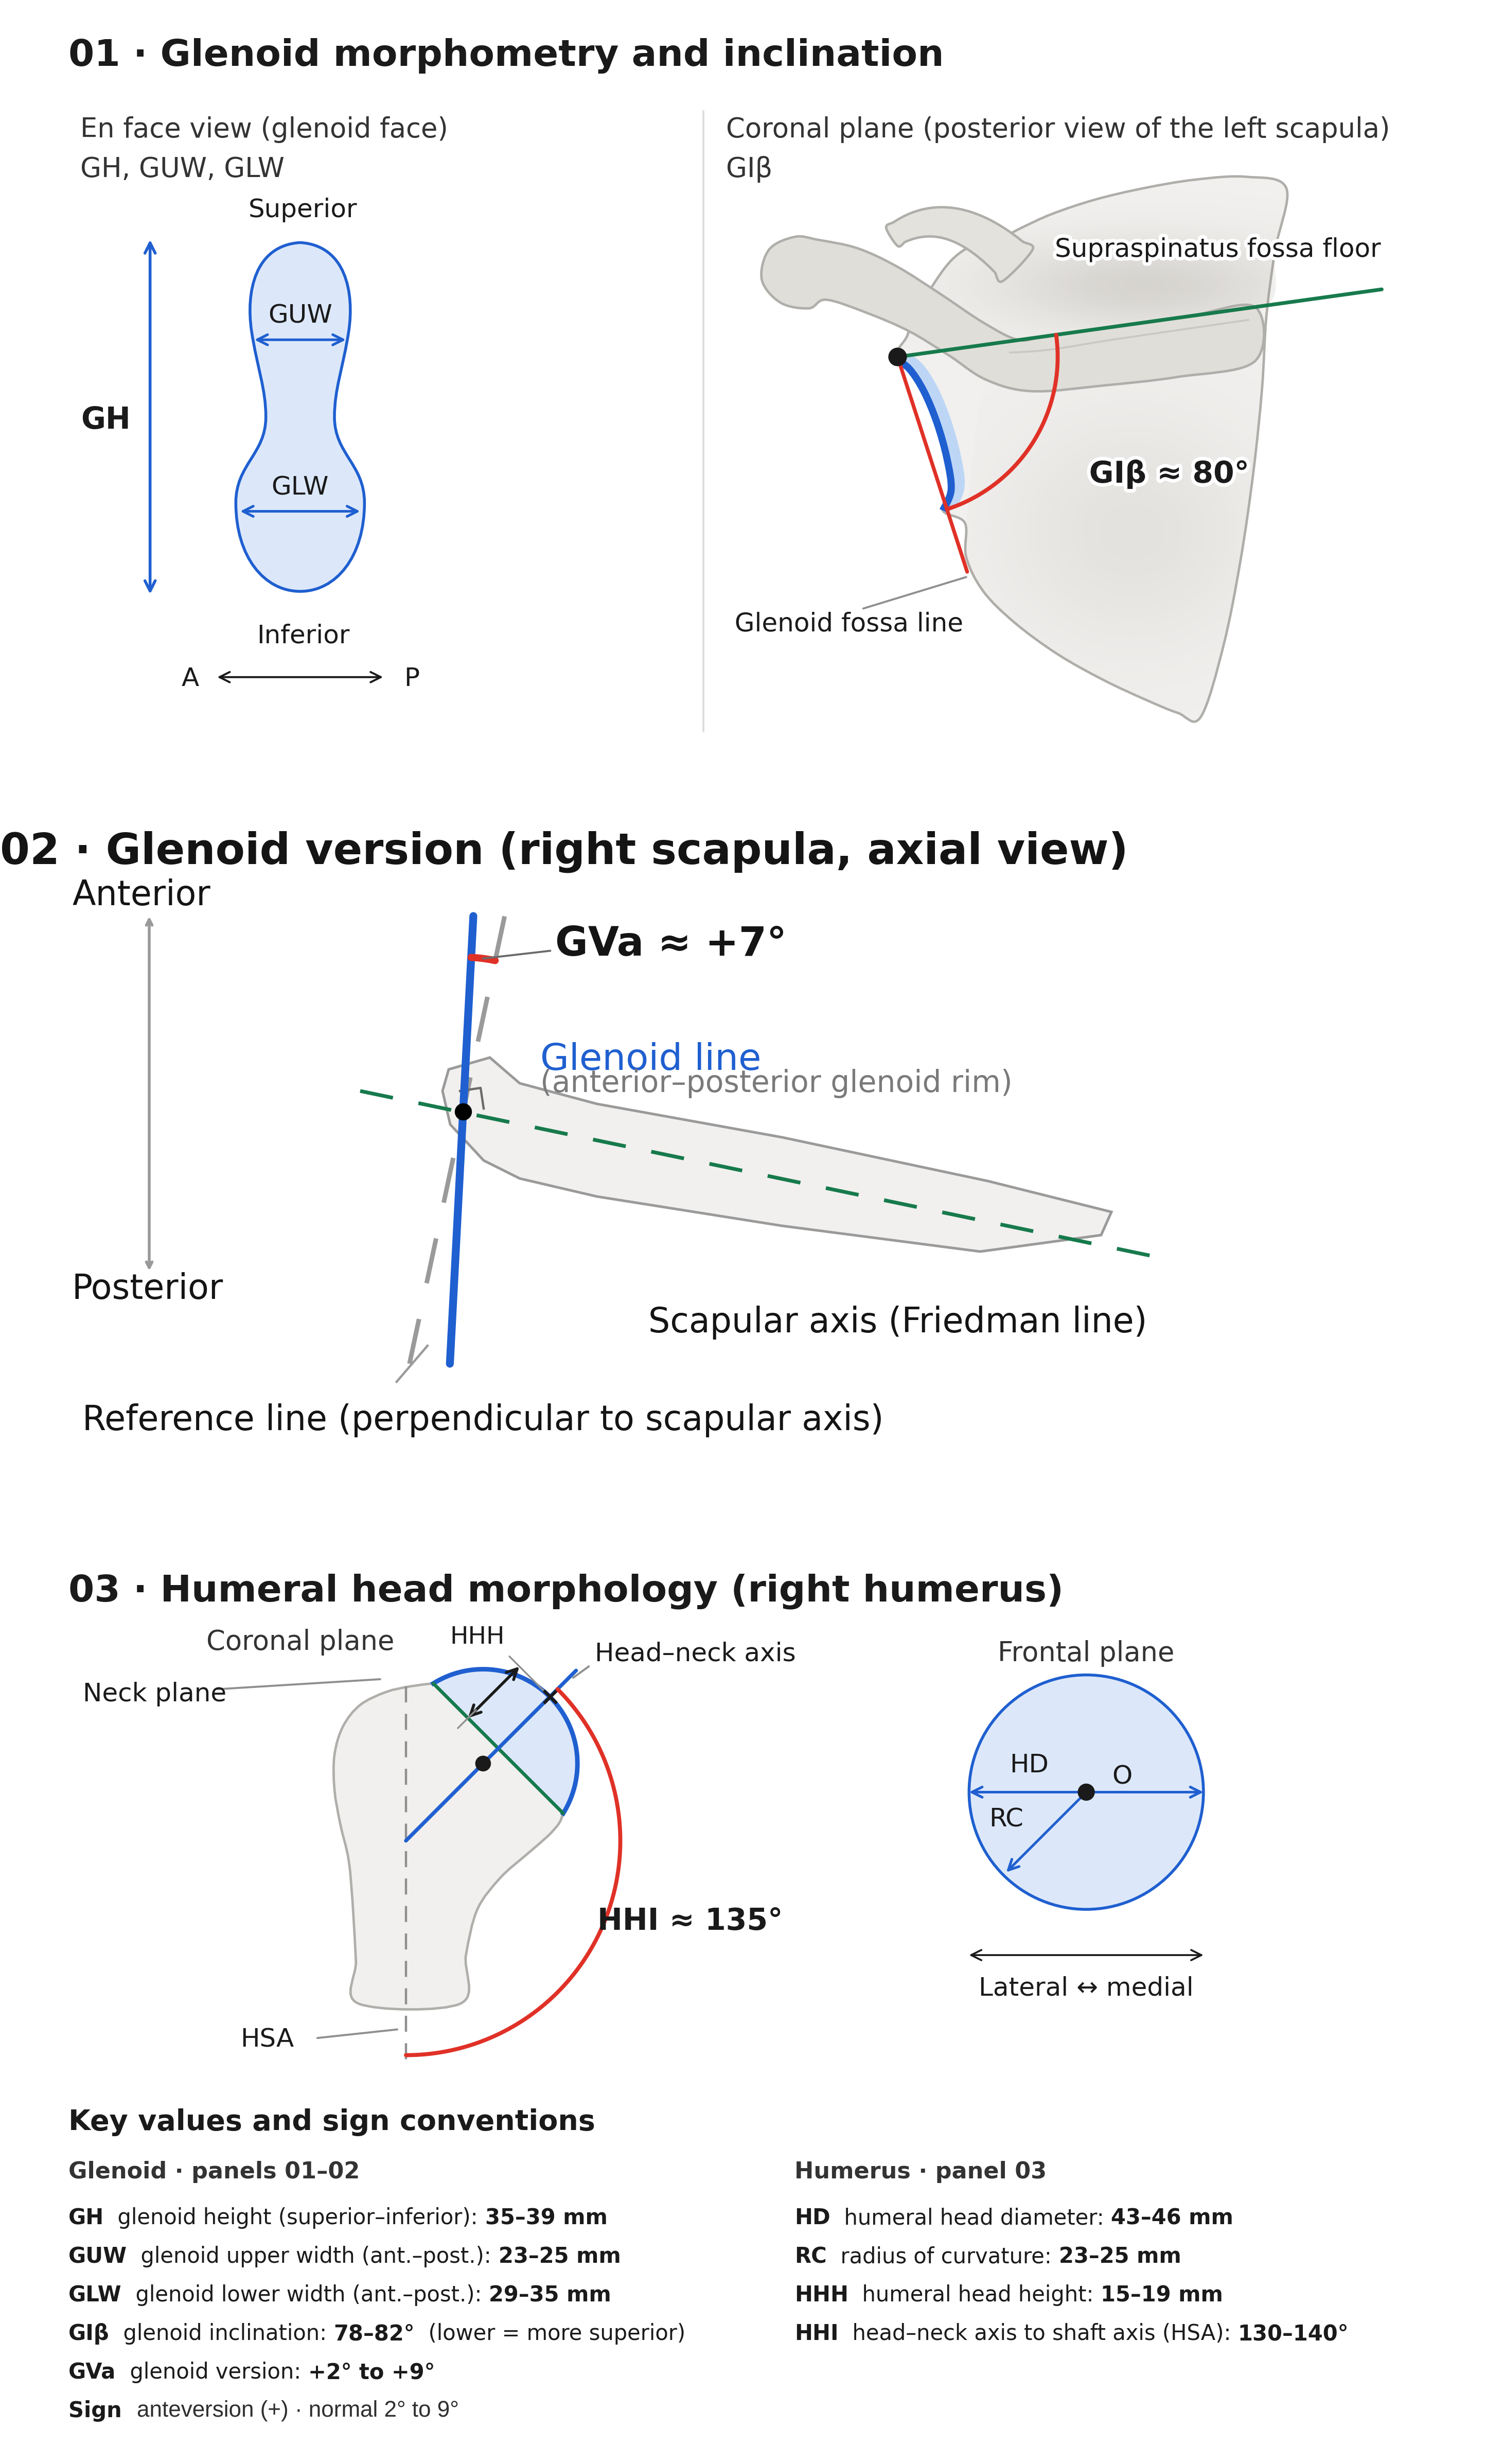
Native DICOM images were reviewed using JiveX medical imaging software (VISUS Health IT GmbH, Bochum, Germany). Two radiologists and two orthopedic surgery residents evaluated the measurements together, resolving any disagreements by consensus. Because independent repeated measurements were not obtained, interobserver and intraobserver reliability could not be assessed.
Statistical Analysis
Continuous distributions were reviewed using summary statistics, skewness, boxplots, and quantile–quantile plots. Means and standard deviations were used where the distribution was reasonably symmetric; glenoid inclination β, which showed material left skew and several low observations, was summarised by median and interquartile range. Group means were compared using Welch's t test, and inclination was compared using the Mann–Whitney U test. Categorical variables were reported as counts and percentages and compared with Pearson's χ² test because all expected counts exceeded five. Effect estimates are presented with 95% confidence intervals where applicable.
The nine prespecified morphometric comparisons formed the primary multiplicity family; age, sex, and side were descriptive covariates and were not included in that family. Binary logistic regression used instability as the outcome (1 = instability; 0 = control). Each morphometric variable was entered in a separate model with age (per year), sex (male vs female), and side (right vs left). Thus, linear models contained four parameters and used 25 events per parameter. Linearity of each morphometric exposure was checked by adding an x·ln(x) term to its covariate-adjusted linear model and applying a one-degree-of-freedom likelihood-ratio test (Box–Tidwell approach). For upper glenoid width (Box–Tidwell p = 0.015), glenoid anteversion α (p = 0.007), and humeral-head diameter (p = 0.005), the Box–Tidwell check indicated non-linearity; these variables were modelled with four-knot restricted cubic splines (knots at the 5th, 35th, 65th, and 95th percentiles). For splines, the odds ratio compares the 75th with the 25th percentile, while the p value is the three-degree-of-freedom global likelihood-ratio test.
Model adequacy was assessed from convergence, predicted probabilities, variance-inflation factors in the retained linear models, Cook's distances, and refitting after removal of the single most influential observation. Spline knots were held fixed during these deletion checks. No automated variable selection was used. Ratios were not analysed because the corrected workbook contained only the nine raw measurement fields and no verified prespecified ratio definitions. Prediction-performance analyses were not performed because the aim was association. Statistical analyses were performed using Python 3.12 with pandas, NumPy, SciPy, statsmodels, and Patsy. Figures were produced using Matplotlib. All tests were two-sided, and p < 0.05 was considered statistically significant. Two independent Benjamini–Hochberg families of nine tests each were used: the nine prespecified bivariate morphometric comparisons (Supplementary Table S1), and the nine covariate-adjusted association tests — six linear-model Wald tests and three spline global likelihood-ratio tests (Table 2). These two families were corrected separately; consequently, a given variable's raw bivariate p value and its adjusted p value do not share a common q value, and a variable's significance in one family does not determine its significance in the other.
Results
Data Integrity and Patient Characteristics
The worksheet contained 200 rows, each with a unique identifier: 100 controls and 100 instability cases. No demographic or morphometric value was missing; group, sex, and side labels were internally consistent; and no exact duplicate analytical or morphometric rows were detected. The second, unnamed spreadsheet column was entirely blank and was excluded from the analysis. Four observations were from patients aged 16–17 years.
Cases were younger than controls (36.84 ± 15.91 vs 51.38 ± 15.35 years; mean difference, −14.54 years; 95% CI −18.90 to −10.18; p < 0.001) and were more often male (75.0% vs 52.0%; unadjusted OR 2.77, 95% CI 1.52–5.04; p < 0.001). Right shoulders accounted for 69.0% of cases and 58.0% of controls (p = 0.106; Table 1).
Group Comparisons
After correcting for the nine morphometric comparisons, instability cases had a greater glenoid height (38.33 ± 3.59 vs 36.63 ± 3.57 mm; q = 0.003), greater glenoid inclination β (median 83.20° vs 80.80°; q = 0.008), lower humeral-head height (17.55 ± 2.98 vs 20.66 ± 4.14 mm; q < 0.001), and greater humeral-head inclination (140.61 ± 7.37° vs 135.45 ± 7.14°; q < 0.001). Upper and lower glenoid width, glenoid anteversion α, humeral-head diameter, and glenoid diameter did not differ significantly in the primary bivariate comparisons.
| Variable | Control (n = 100) | Instability (n = 100) | Effect estimate (95% CI) | Raw p | BH q |
|---|---|---|---|---|---|
| Age, years | 51.38 ± 15.35 | 36.84 ± 15.91 | Mean difference −14.54 (−18.90 to −10.18) | <0.001 | — |
| Male sex, n (%) | 52 (52.0) | 75 (75.0) | OR 2.77 (1.52 to 5.04) | <0.001 | — |
| Right shoulder, n (%) | 58 (58.0) | 69 (69.0) | OR 1.61 (0.90 to 2.88) | 0.106 | — |
| Glenoid height, mm | 36.63 ± 3.57 | 38.33 ± 3.59 | Mean difference 1.70 (0.70 to 2.70) | <0.001 | 0.003 |
| Glenoid upper width, mm | 16.28 ± 2.28 | 16.58 ± 1.66 | Mean difference 0.30 (−0.25 to 0.86) | 0.286 | 0.428 |
| Glenoid lower width, mm | 22.88 ± 2.35 | 23.45 ± 2.36 | Mean difference 0.57 (−0.09 to 1.22) | 0.091 | 0.164 |
| Glenoid inclination β, degrees | 80.80 (77.55–84.60) | 83.20 (79.90–86.30) | Hodges–Lehmann shift 2.20 (0.80 to 3.60); Hedges g 0.47 | 0.003 | 0.008 |
| Glenoid anteversion α, degrees | 9.85 ± 2.84 | 9.80 ± 4.00 | Mean difference −0.05 (−1.02 to 0.92) | 0.922 | 0.922 |
| Humeral head height, mm | 20.66 ± 4.14 | 17.55 ± 2.98 | Mean difference −3.11 (−4.11 to −2.10) | <0.001 | <0.001 |
| Humeral head inclination, degrees | 135.45 ± 7.14 | 140.61 ± 7.37 | Mean difference 5.17 (3.14 to 7.19) | <0.001 | <0.001 |
| Humeral head diameter, mm | 42.59 ± 4.02 | 42.32 ± 2.99 | Mean difference −0.28 (−1.26 to 0.71) | 0.582 | 0.655 |
| Glenoid diameter, mm | 23.35 ± 2.46 | 23.61 ± 2.59 | Mean difference 0.27 (−0.44 to 0.97) | 0.458 | 0.589 |
Adjusted Associations
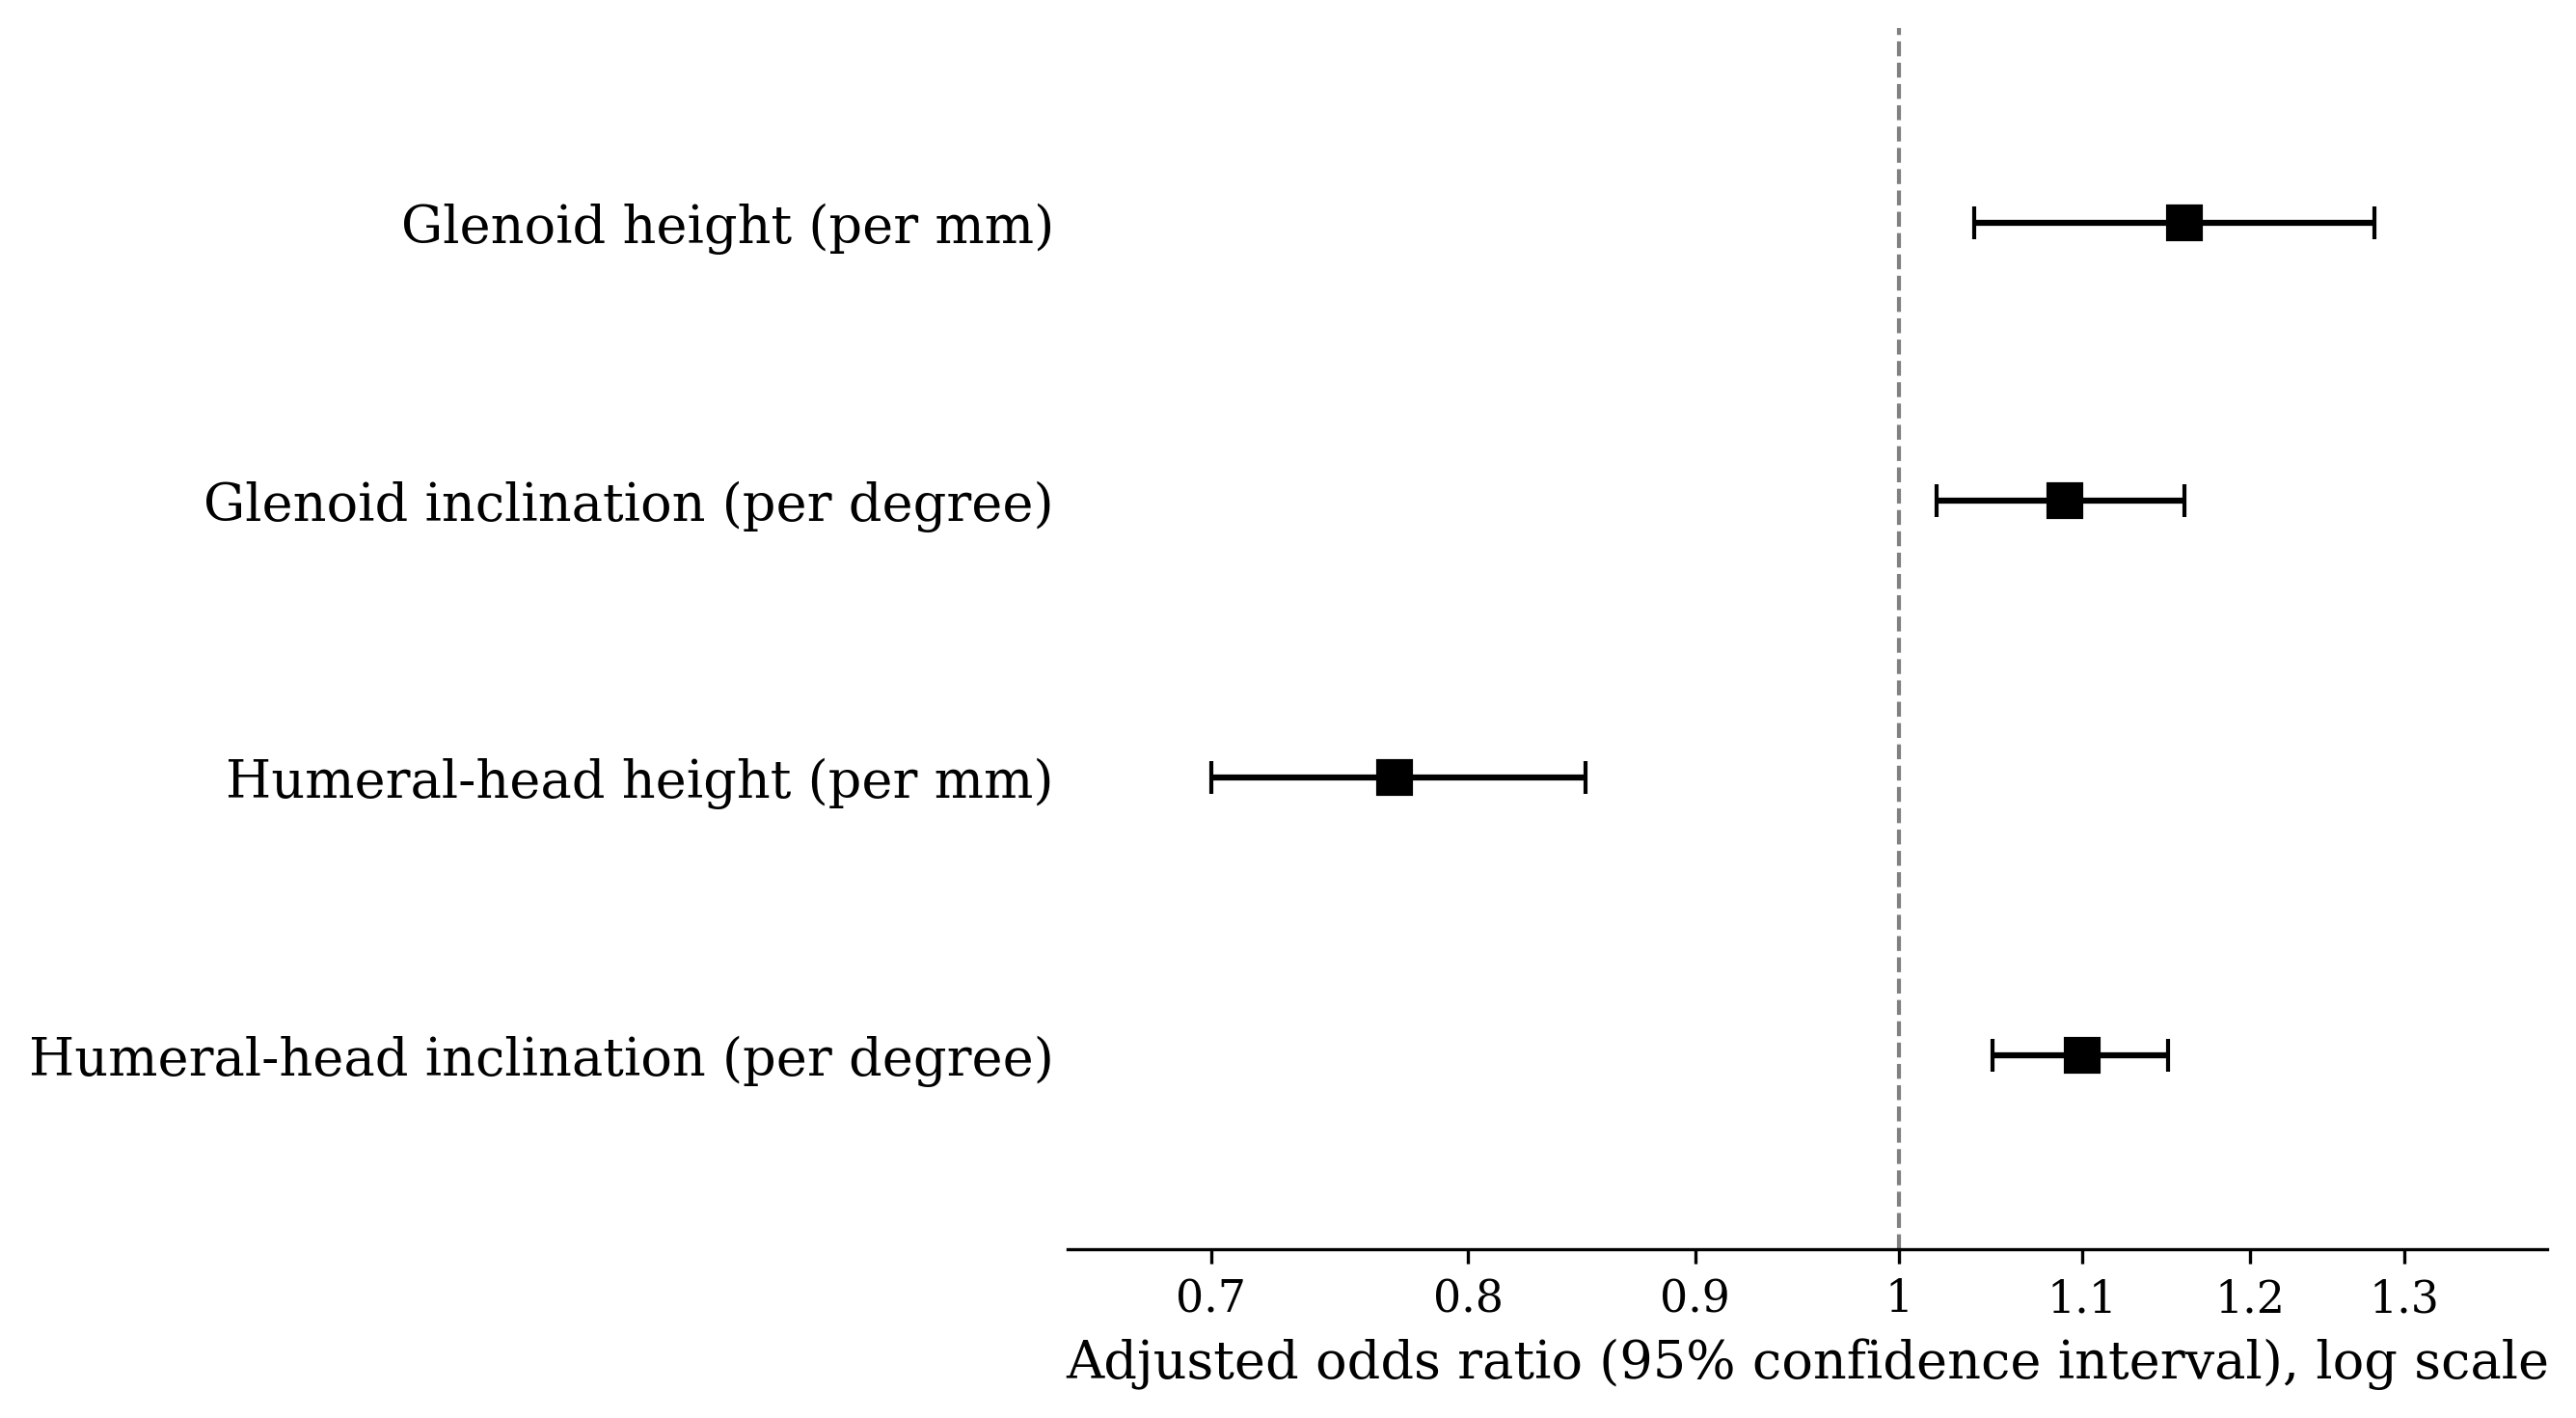
In linear adjusted models, greater glenoid height (OR 1.16 per millimetre, 95% CI 1.04–1.28), greater glenoid inclination (OR 1.09 per degree, 95% CI 1.02–1.16), lower humeral-head height (OR 0.77 per millimetre, 95% CI 0.70–0.85), and greater humeral-head inclination (OR 1.10 per degree, 95% CI 1.05–1.15) were associated with case status after adjustment for age, sex, and side and remained significant after false-discovery-rate correction (Table 2; Figure 3).
Upper width, glenoid anteversion α, and humeral-head diameter did not satisfy the linearity assumption and were therefore fitted with restricted cubic splines. After correction (BH q < 0.05), the global spline tests were statistically significant for glenoid anteversion α (p = 0.022; q = 0.033) and humeral-head diameter (p < 0.001; q = 0.001), although their non-monotonic shapes did not support the use of a single per-unit odds ratio, and the 75th-versus-25th-percentile contrasts crossed unity. These shape findings should be interpreted cautiously until reproduced. For comparison, a linear-only adjusted model for humeral-head diameter (that is, omitting the spline terms) yielded a nominally significant, apparently monotonic odds ratio (OR 0.84, 95% CI 0.75–0.95, p = 0.004); however, when the raw values were grouped into quintiles, a clearly non-monotonic (peaked) relationship was found between humeral-head diameter and case status, rather than a consistent linear trend. This indicates that the linear-only estimate is an artefact of the underlying non-monotonic shape rather than evidence of a true per-millimetre effect, and it illustrates why the Box–Tidwell/spline step was necessary rather than optional for this variable.
| Predictor | Unit or contrast | Adjusted OR | 95% CI | Raw p | BH q | Form |
|---|---|---|---|---|---|---|
| Glenoid height | Per 1 mm | 1.16 | 1.04–1.28 | 0.006 | 0.014 | Linear |
| Glenoid upper width | 17.60 vs 15.28 mm | 1.45 | 0.57–3.67 | 0.103 | 0.133 | Spline; global test |
| Glenoid lower width | Per 1 mm | 1.01 | 0.86–1.18 | 0.916 | 0.916 | Linear |
| Glenoid inclination β | Per 1° | 1.09 | 1.02–1.16 | 0.008 | 0.015 | Linear |
| Glenoid anteversion α | 11.93 vs 7.18° | 0.44 | 0.18–1.08 | 0.022 | 0.033 | Spline; global test |
| Humeral head height | Per 1 mm | 0.77 | 0.70–0.85 | <0.001 | <0.001 | Linear |
| Humeral head inclination | Per 1° | 1.10 | 1.05–1.15 | <0.001 | <0.001 | Linear |
| Humeral head diameter | 45.20 vs 39.70 mm | 0.68 | 0.23–1.98 | <0.001 | 0.001 | Spline; global test |
| Glenoid diameter | Per 1 mm | 0.98 | 0.85–1.13 | 0.792 | 0.890 | Linear |
Model Diagnostics and Sensitivity Analysis
All nine final models converged with finite estimates. Predicted probabilities ranged from approximately 0.022 to 0.974, and the maximum variance-inflation factor among the six retained linear models was 1.52. Across the final linear and spline models, maximum Cook's distances ranged from 0.036 to 0.090, and several observations exceeded the 4/n screening threshold. Removing the most influential observation from each retained linear model did not alter the direction or nominal statistical significance of the four principal morphometric associations. In an exploratory deletion check, the upper-width spline global p value changed from 0.103 to 0.030, indicating sensitivity to a single observation; the full-data result remained the primary analysis. The low glenoid-height value for Cont_002 (26.4 mm) was retained; excluding it changed the adjusted glenoid-height OR from 1.16 to 1.14 and the p value from 0.006 to 0.016.
Discussion
Principal Findings
Four measurements showed a consistent, monotonic adjusted association with a history of anterior instability: greater glenoid height, greater glenoid inclination, lower humeral-head height, and greater humeral-head inclination. These estimates came from separate covariate-adjusted models rather than from a single saturated model containing all nine measurements. By contrast, glenoid anteversion α and humeral-head diameter showed more complex non-linear associations, which should not be reduced to a constant per-degree or per-millimetre effect.
Comparison With Relevant Literature
The greater glenoid height observed here differs from the small three-dimensional study by Peltz et al., which found no difference in absolute glenoid height or width,[3] and from Kıvrak and Ulusoy, who reported similar glenoid height and inclination between groups despite differences in width, version, depth, and curvature.[5] It is, however, directionally consistent with the CT-based study by Niu et al., in which instability cases had greater glenoid height and smaller width than matched controls.[7] In Cohn et al.'s cohort of patients younger than 21 years, the simple glenoid and humeral-head dimensions did not differ overall, but male instability patients had smaller glenoid width and surface area than male controls.[6] Different inclusion criteria, age distributions, imaging platforms, and measurement definitions limit direct comparison.
A radiographic case-control study of 88 shoulders found no significant association between the innate humeral-head-to-glenoid diameter ratio and instability.[13] Normal-population studies also show that absolute glenohumeral dimensions vary with sex, body size, and population, which complicates direct comparison of raw millimetric measurements across cohorts.[14][15] In a Lebanese CT cohort, glenoid height and width were strongly correlated, and sex-specific estimation formulas performed differently from formulas derived in other populations.[16]
Concavity is another dimension not captured by height or width alone. Cadaveric assessment shows direction-dependent bony and osteochondral concavity,[17] while a clinical case-control study found lower superoinferior concavity in instability cases but only limited clinical impact of version.[18] These findings support treating glenoid morphology as multidimensional rather than interpreting any single diameter in isolation.
Version findings also vary across studies. Hohmann and Tetsworth reported that anterior-instability cases were less retroverted and more inferiorly inclined than controls.[4] A 2026 CT case-control study found greater anterior version among recurrent cases than among single-dislocation cases and controls.[8] Another CT case-control study reported increased inferior glenoid anteversion and a higher glenoid index in recurrent dislocation cases.[19] Positive α values represented glenoid anteversion. The non-linear association with case status did not support a single uniform per-degree effect.
Clinical Interpretation
These estimates describe differences between existing cases and controls. They are not incidence-rate ratios, do not indicate future risk, and should not be used as treatment thresholds. The timing of the MRI is especially important: because cases were imaged after instability had occurred, the study cannot establish whether a measurement preceded the instability episode or was altered by it.
Strengths and Limitations
The corrected dataset was complete for the specified variables, contained balanced case and control groups, and supported adjustment for three demographic covariates without sparse modelling. Multiplicity was handled separately for the nine bivariate and nine adjusted morphometric tests, and non-linearity was addressed explicitly.
The major limitations are the retrospective case-control design, post-instability imaging in cases, and the use of a convenience sample rather than a cohort powered a priori, which may limit the study's ability to detect smaller morphological differences. With 100 cases and 100 controls, the study had approximately 80% power at α = 0.05 to detect a between-group difference of approximately 0.40 standard deviations (Cohen's d) for a normally distributed continuous measure; for example, this corresponds to raw differences of roughly 0.8 mm for glenoid upper width, 0.9 mm for glenoid lower width, and 1.0 mm for glenoid diameter, using each variable's pooled standard deviation. The observed mean differences for these three non-significant variables (0.30 mm, 0.57 mm, and 0.27 mm, respectively) were all below this threshold, so a true difference of this smaller magnitude cannot be excluded and should be interpreted as not detected rather than absent. Bone loss and instability burden were not recorded; consequently, their potential influence on the observed morphometric associations could not be assessed. Consensus measurement by four observers produced one agreed value but did not permit quantitative assessment of interobserver or intraobserver reliability. The non-linear findings may be sample-specific, and residual confounding remains possible. In addition, analysing multiple related measurements in separate models avoids an unstable saturated model but does not estimate their mutually independent effects. Finally, the inclusion of four participants aged 16–17 years introduces a minor consideration regarding skeletal maturity; however, because these individuals accounted for only 2% of the total analytical cohort, their influence on the aggregate linear and adjusted association models is minimal and did not necessitate a separate exclusion sensitivity analysis.
Future Directions
Future studies should use a documented, standardised imaging protocol before any instability episode, record bone loss and instability burden, perform independent repeated measurements, and validate both the monotonic and non-linear associations in an external cohort.
Conclusion
Greater glenoid height and inclination, lower humeral-head height, and greater humeral-head inclination were associated with a documented history of anterior shoulder instability after adjustment for age, sex, and shoulder side. The findings describe association, not prediction or causation, and they cannot establish that the measured morphology existed before instability.
Declarations
Ethics approval: [AUTHOR CONFIRMATION REQUIRED]
Funding: No funding was received for this study.
Conflict of interest: The authors declare no conflicts of interest.
Author contributions: Antoine Mezher contributed to methodology, investigation, data curation, formal analysis, and preparation of the initial manuscript draft. Joseph Maalouly contributed to investigation, validation, resources, manuscript review and editing, and supervision. George El Rassi contributed to conceptualisation, methodology, resources, manuscript review and editing, supervision, and project administration. All authors reviewed and approved the final manuscript.
References
- Zacchilli MA, Owens BD. Epidemiology of shoulder dislocations presenting to emergency departments in the United States. J Bone Joint Surg Am. 2010;92(3):542–549. https://doi.org/10.2106/JBJS.I.00450
- Olds M, Ellis R, Donaldson K, Parmar P, Kersten P. Risk factors which predispose first-time traumatic anterior shoulder dislocations to recurrent instability in adults: a systematic review and meta-analysis. Br J Sports Med. 2015;49(14):913–922. https://doi.org/10.1136/bjsports-2014-094342
- Peltz CD, Zauel R, Ramo N, Mehran N, Moutzouros V, Bey MJ. Differences in glenohumeral joint morphology between patients with anterior shoulder instability and healthy, uninjured volunteers. J Shoulder Elbow Surg. 2015;24(7):1014–1020. https://doi.org/10.1016/j.jse.2015.03.024
- Hohmann E, Tetsworth K. Glenoid version and inclination are risk factors for anterior shoulder dislocation. J Shoulder Elbow Surg. 2015;24(8):1268–1273. https://doi.org/10.1016/j.jse.2015.03.032
- Kıvrak A, Ulusoy İ. Effect of glenohumeral joint bone morphology on anterior shoulder instability: a case-control study. J Clin Med. 2023;12(15):4910. https://doi.org/10.3390/jcm12154910
- Cohn MR, DeFroda SF, Huddleston HP, et al. Does native glenoid anatomy predispose to shoulder instability? An MRI analysis. J Shoulder Elbow Surg. 2022;31(6 Suppl):S110–S116. https://doi.org/10.1016/j.jse.2022.03.002
- Niu Z, Shen X, Li M, Fan M, Zuo J, Liu T. Comparison of glenohumeral bone morphology between patients with versus without anterior shoulder instability. Orthop J Sports Med. 2023;11(12):23259671231217971. https://doi.org/10.1177/23259671231217971
- Altuntas Y, Yagci IT, Ipek E, et al. Glenoid version and recurrent anterior shoulder dislocation: a case–control study. BMC Musculoskelet Disord. 2026;27:213. https://doi.org/10.1186/s12891-026-09594-3
- von Elm E, Altman DG, Egger M, Pocock SJ, Gøtzsche PC, Vandenbroucke JP. The Strengthening the Reporting of Observational Studies in Epidemiology (STROBE) statement: guidelines for reporting observational studies. PLoS Med. 2007;4(10):e296. https://doi.org/10.1371/journal.pmed.0040296
- Becker B, Spadafore S, Oberle L, Spittler J, Khodaee M. Epidemiology of shoulder dislocation treated at emergency departments in the United States between 1997 and 2021. Orthop J Sports Med. 2024;12(3):23259671241234930. https://doi.org/10.1177/23259671241234930
- Itoi E. "On-track" and "off-track" shoulder lesions. EFORT Open Rev. 2017;2(8):343–351. https://doi.org/10.1302/2058-5241.2.170007
- Ernstbrunner L, Werthel JD, Hatta T, Thoreson AR, Resch H, An KN, Moroder P. Biomechanical analysis of the effect of congruence, depth and radius on the stability ratio of a simplistic "ball-and-socket" joint model. Bone Joint Res. 2016;5(10):453–460. https://doi.org/10.1302/2046-3758.510.BJR-2016-0078.R1
- Willigenburg NW, Bouma RA, Scholtes VAB, van der Hulst VPM, van Deurzen DFP, van den Bekerom MPJ. Does the innate relative size of the humeral head and glenoid affect the risk of anterior shoulder instability? Shoulder Elbow. 2019;11(6):424–429. https://doi.org/10.1177/1758573218805099
- Suroto H, Licindo D, Wibowo PA, et al. Morphology of humeral head and glenoid in normal shoulder of Indonesian population. Orthop Res Rev. 2022;14:459–469. https://doi.org/10.2147/ORR.S378658
- Maalouly J, Tawk A, Aouad D, et al. Is there an association between glenoid parameters and rotator cuff tears and the influence of gender: a retrospective study on a Middle Eastern population. Int J Surg Case Rep. 2020;68:74–82. https://doi.org/10.1016/j.ijscr.2020.02.035
- Bizdikian AJ, El Rassi J, El-Haddad E, et al. The use of linear formulas to estimate glenoid bone loss in the Lebanese population: a 3-dimensional computed tomography study. Orthop J Sports Med. 2024;12(6):23259671241249715. https://doi.org/10.1177/23259671241249715
- Wermers J, Raschke MJ, Wilken M, Riegel A, Katthagen JC. The anatomy of glenoid concavity—bony and osteochondral assessment of a stability-related parameter. J Clin Med. 2021;10(19):4316. https://doi.org/10.3390/jcm10194316
- Oenning S, de Castillo C, Jacob E, et al. The clinical impact of glenoid concavity and version on anterior shoulder stability. JSES Int. 2025;9(1):62–69. https://doi.org/10.1016/j.jseint.2024.09.029
- Azam MQ, Syed A, Sharma A, Yadav A, Sarkar B, Paul N. Influence of inferior glenoid version and glenoid index on recurrent anterior shoulder dislocation. JSES Int. 2025;9(6):1901–1907. https://doi.org/10.1016/j.jseint.2025.06.005
Supplementary Material
| Measurement | Test | Raw p | BH q | Significant after BH |
|---|---|---|---|---|
| Glenoid height | Welch t test | <0.001 | 0.003 | Yes |
| Glenoid upper width | Welch t test | 0.286 | 0.428 | No |
| Glenoid lower width | Welch t test | 0.091 | 0.164 | No |
| Glenoid inclination β | Mann–Whitney U | 0.003 | 0.008 | Yes |
| Glenoid anteversion α | Welch t test | 0.922 | 0.922 | No |
| Humeral head height | Welch t test | <0.001 | <0.001 | Yes |
| Humeral head inclination | Welch t test | <0.001 | <0.001 | Yes |
| Humeral head diameter | Welch t test | 0.582 | 0.655 | No |
| Glenoid diameter | Welch t test | 0.458 | 0.589 | No |
| Variable | GH | GUW | GLW | GIβ | GVα | HHH | HHI | HD | GD |
|---|---|---|---|---|---|---|---|---|---|
| GH | 1.00 | 0.40 | 0.46 | 0.07 | -0.05 | -0.00 | 0.07 | 0.41 | 0.35 |
| GUW | 0.40 | 1.00 | 0.45 | 0.07 | 0.09 | 0.13 | 0.03 | 0.38 | 0.51 |
| GLW | 0.46 | 0.45 | 1.00 | -0.03 | 0.11 | 0.15 | -0.01 | 0.54 | 0.74 |
| GIβ | 0.07 | 0.07 | -0.03 | 1.00 | -0.21 | -0.19 | 0.12 | -0.18 | -0.01 |
| GVα | -0.05 | 0.09 | 0.11 | -0.21 | 1.00 | 0.13 | -0.04 | 0.17 | 0.14 |
| HHH | -0.00 | 0.13 | 0.15 | -0.19 | 0.13 | 1.00 | -0.32 | 0.29 | 0.14 |
| HHI | 0.07 | 0.03 | -0.01 | 0.12 | -0.04 | -0.32 | 1.00 | -0.06 | -0.04 |
| HD | 0.41 | 0.38 | 0.54 | -0.18 | 0.17 | 0.29 | -0.06 | 1.00 | 0.47 |
| GD | 0.35 | 0.51 | 0.74 | -0.01 | 0.14 | 0.14 | -0.04 | 0.47 | 1.00 |
| Measurement | Box–Tidwell p | Spline global p | 75th vs 25th percentile OR (95% CI) |
|---|---|---|---|
| Glenoid upper width | 0.015 | 0.103 | 1.45 (0.57–3.67) |
| Glenoid anteversion α | 0.007 | 0.022 | 0.44 (0.18–1.08) |
| Humeral head diameter | 0.005 | <0.001 | 0.68 (0.23–1.98) |
| Item | Recommendation | Location/status |
|---|---|---|
| 1 | Design in title/abstract; balanced summary | Title and Abstract |
| 2–3 | Background and objectives | Introduction |
| 4 | Key design elements | §2.1 |
| 5 | Setting and dates | §2.1; dates and institution reported |
| 6 | Eligibility and case/control selection | §2.2–2.3 and Figure 1 |
| 7 | Variables | §2.3–2.4 |
| 8 | Data sources and measurement | §2.4; acquisition protocol, measurement definitions, and direct diameter measurement reported |
| 9 | Bias | §4.4 |
| 10 | Study size | Case and control screening and final counts reported; convenience-sample basis described; retrospective precision statement in §4.4 |
| 11–12 | Quantitative variables and statistical methods | §2.5 |
| 13 | Participant flow | Figure 1 |
| 14 | Descriptive data and missingness | §3.1 and Table 1 |
| 15–16 | Outcome data and main estimates | §3.2–3.3; Tables 1–2 |
| 17 | Other analyses | §3.4 and Table S3 |
| 18–21 | Key results, limitations, interpretation, generalisability | Discussion |
| 22 | Funding | Declarations |