Introduction
Anterior shoulder instability regularly affects young, physically active patients, and repeated episodes can progressively damage the capsulolabral structures, cartilage, and bone.[1][2] The condition reflects a combination of trauma, soft-tissue restraint, neuromuscular control, activity level, and osseous anatomy. Bone loss can act as both a cause and a consequence of recurrent instability, and the on-track/off-track framework is essential to the surgical assessment of bipolar bone loss.[3] Glenoid concavity and concavity-compression contribute to resistance against humeral head translation,[4][5] and joint congruence, socket depth, and the glenoid labrum contribute to stability as well.[6][7] Together, these findings raise a reasonable question: does the native geometry of the joint make a shoulder prone to instability even before the first episode occurs?
Imaging studies have linked anterior instability to glenoid dimensions, but results differ from one cohort to the next and depend on the measurement method used,[8][9] and studies comparing glenoid and humeral geometry have likewise produced inconsistent findings.[10][11] Evidence for an association between the relative sizes of the humeral head and glenoid and instability has also been inconsistent,[12][13] and morphometric reference values differ by sex and population.[14][15] Nevertheless, data on this variation in Middle Eastern populations remain limited.[16]
Establishing temporal sequence matters when morphology is considered a susceptibility factor, because images obtained after instability cannot reliably distinguish native anatomy from changes caused by dislocation, repeated translation, bone loss, or prior stabilization. Prospective baseline imaging addresses this problem directly. Owens and colleagues followed 714 young athletes for four years after baseline bilateral MRI and found that both the glenoid index and the coracohumeral interval were independent risk factors for subsequent instability.[17] Age has also been shown to influence the natural course of anterior instability: in a large US population-based cohort, patients aged 16 to 20 had the highest rates of both surgical stabilization and recurrence after surgery among patients under 40 years of age.[18] In Middle Eastern populations, data that account for age along with a wide range of glenoid and humeral measurements remain rare.
The present cohort consisted of athletes who engage in sports involving repeated overhead arm movements, which subject the anterior capsulolabral complex and rotator cuff to recurring loading. Because baseline imaging in this group was obtained before any instability event occurred, it provides a chance to determine whether static glenohumeral morphology alone reflects susceptibility in athletes already exposed to this repetitive biomechanical demand.
This study aimed to determine whether glenohumeral anatomical features measured on MRI before any known instability, combined with age, sex, and shoulder side, were linked to the later development of anterior shoulder instability in a group of Middle Eastern overhead athletes.
Materials and Methods
Design and study setting
We conducted this retrospective longitudinal cohort study at St. George's University Medical Center in Beirut. We reviewed baseline shoulder MRI scans from 250 overhead athletes who met the eligibility criteria; we selected these athletes from a consecutive series of 280 athletes seen in 2020 for persistent shoulder pain (for further details, see Patient Identification and Eligibility, below). The most common referral reasons were subacromial impingement syndrome, rotator cuff tendinopathy or partial-thickness tear, internal (posterosuperior) impingement, superior labral (SLAP) lesions, and biceps tendinopathy. At the time of imaging, none of the athletes had a recorded history of glenohumeral instability. Each athlete was followed for about five years after the baseline MRI and was then categorized according to whether anterior shoulder instability was documented during that time.
Ethics approval: [AUTHOR VERIFICATION NEEDED: state the ethics committee/IRB name, the approval reference number, the date of approval, and the consent-or-waiver plan used for participants.] Nine patients (3.6% of the cohort; 8 male, 1 female) were 16 to 17 years old at baseline; of these, 5 later developed instability and 4 remained stable. For these nine minors, skeletal maturity was confirmed both clinically and radiographically before enrollment, written informed assent was obtained from each minor, and written informed consent was obtained from a parent or legal guardian.
Patient Identification and Eligibility
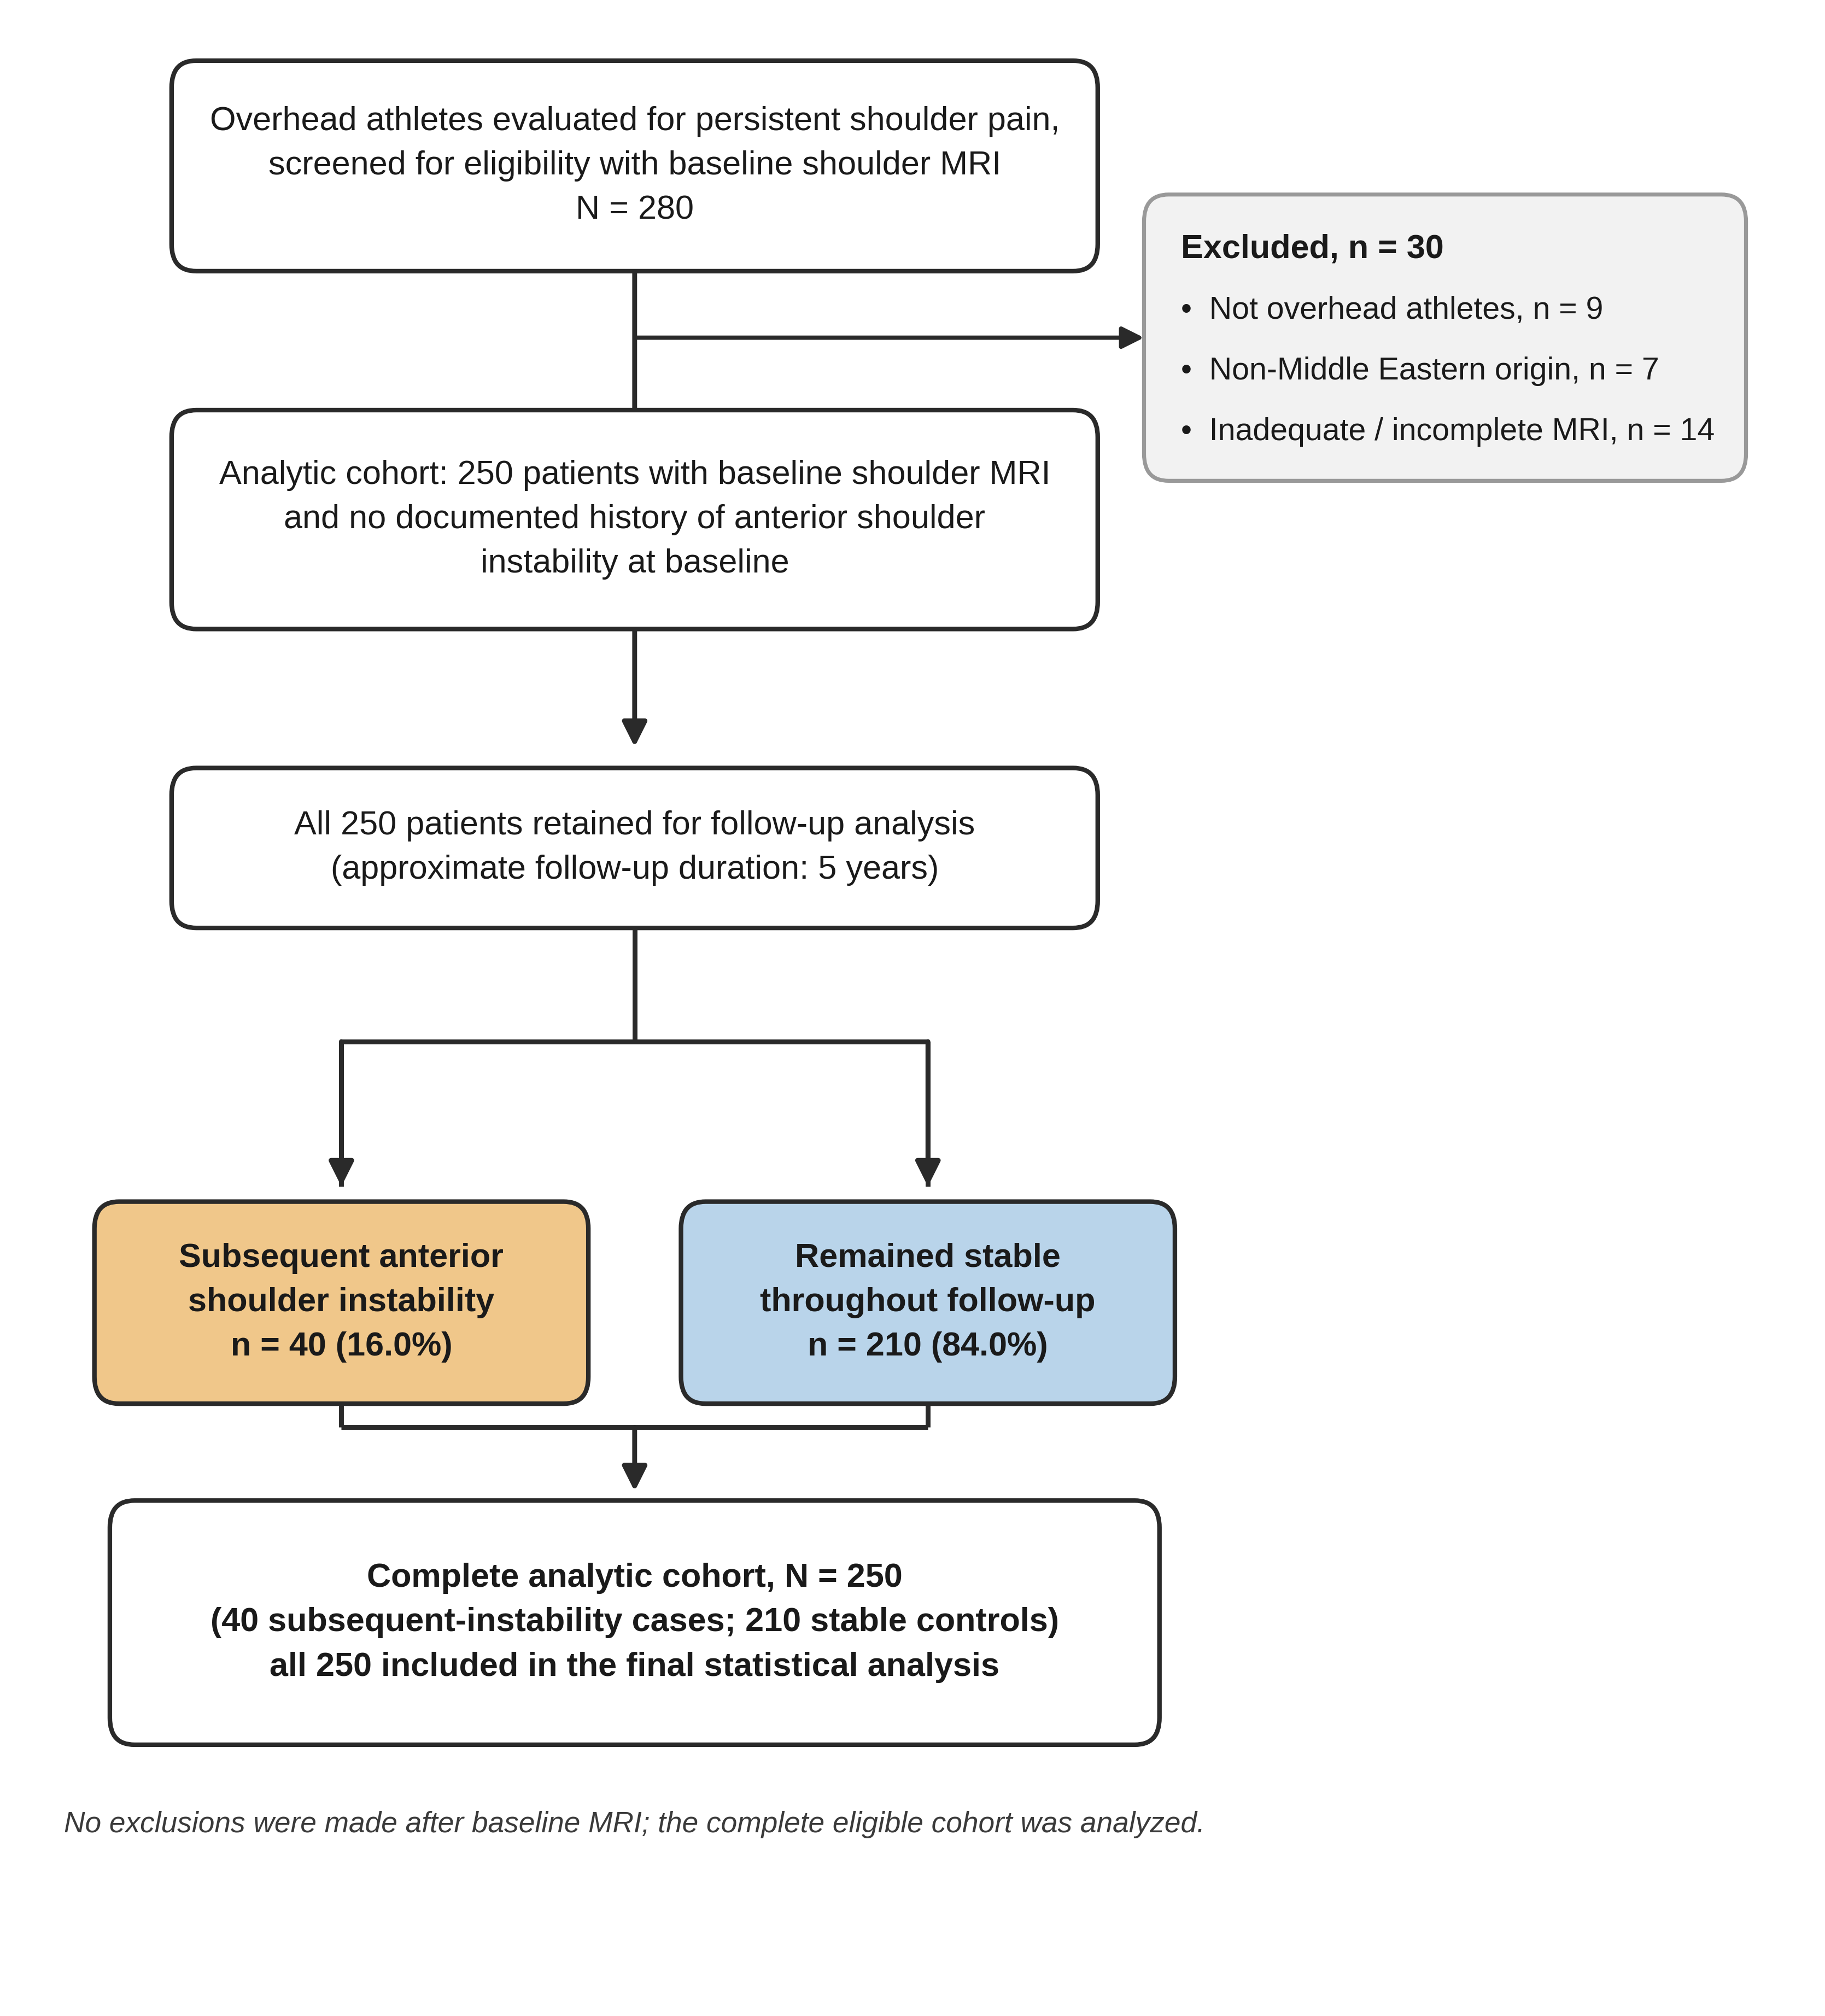
We assembled a consecutive series by screening 280 overhead athletes evaluated for persistent shoulder pain at the study institution in 2020. To be eligible, an athlete had to have been evaluated for persistent shoulder pain, have a baseline shoulder MRI available for review, have no prior documented dislocation, subluxation, or clinical instability before that scan, and have confirmed skeletal maturity (clinically and by MRI) before enrollment. Athletes participated in their primary overhead sport at least 2 to 3 times per week, reflecting consistent, repetitive training volume; the cohort included both competitive amateur and regular recreational athletes, drawn mainly from tennis, volleyball, padel, basketball, swimming, weightlifting, and badminton. Middle Eastern origin was established from the self-reported demographic and nationality data recorded at registration in our hospital's electronic medical record system, and athletes who were not of Middle Eastern origin on that basis were excluded. We also strictly excluded patients with any history or clinical records indicating posterior or multidirectional instability, to avoid confounding from a separate biomechanical pathway. We excluded 30 athletes from the study (9 were not overhead athletes, 7 were not of Middle Eastern origin, and 14 had inadequate or incomplete MRIs), leaving 250 overhead athletes who met the eligibility criteria for this analysis and formed the complete analytic cohort (Figure 2). Athletes were enrolled at their baseline MRI at different points during 2020 and were followed to a common end-of-study date, yielding a follow-up duration of approximately 5 years for each athlete; no athlete was lost to follow-up before the end-of-study date. Forty athletes (16.0%) had a documented episode of anterior shoulder instability after the index MRI during the follow-up period, while the other 210 athletes (84.0%) had no documented instability and stayed stable right up to the end of follow-up.
Baseline MRI and Subsequent Classification
Each patient underwent shoulder MRI with no prior history of dislocation, subluxation, or clinical instability. Anterior instability was defined as a documented history of either a true anterior glenohumeral dislocation or an anterior shoulder subluxation. To ensure diagnostic reliability and avoid the ambiguity of patient-reported symptoms, these events were identified by directly reviewing physician clinical notes within our institutional electronic medical record (EMR) system; all included cases required a formal diagnosis specifically documented by either an emergency department physician or an evaluating orthopedic surgeon, and shoulders lacking a definitive provider diagnosis in the system notes were excluded from the case cohort. The case cohort included both traumatic and atraumatic episodes of anterior instability; our primary focus was the bone morphology associated with anterior instability itself, regardless of the initial inciting mechanism. To prevent bias during data collection, two orthopedic surgery residents verified these historical EMR outcomes and were blinded to the patients' baseline MRI measurements.
Imaging and Morphometric Measurement
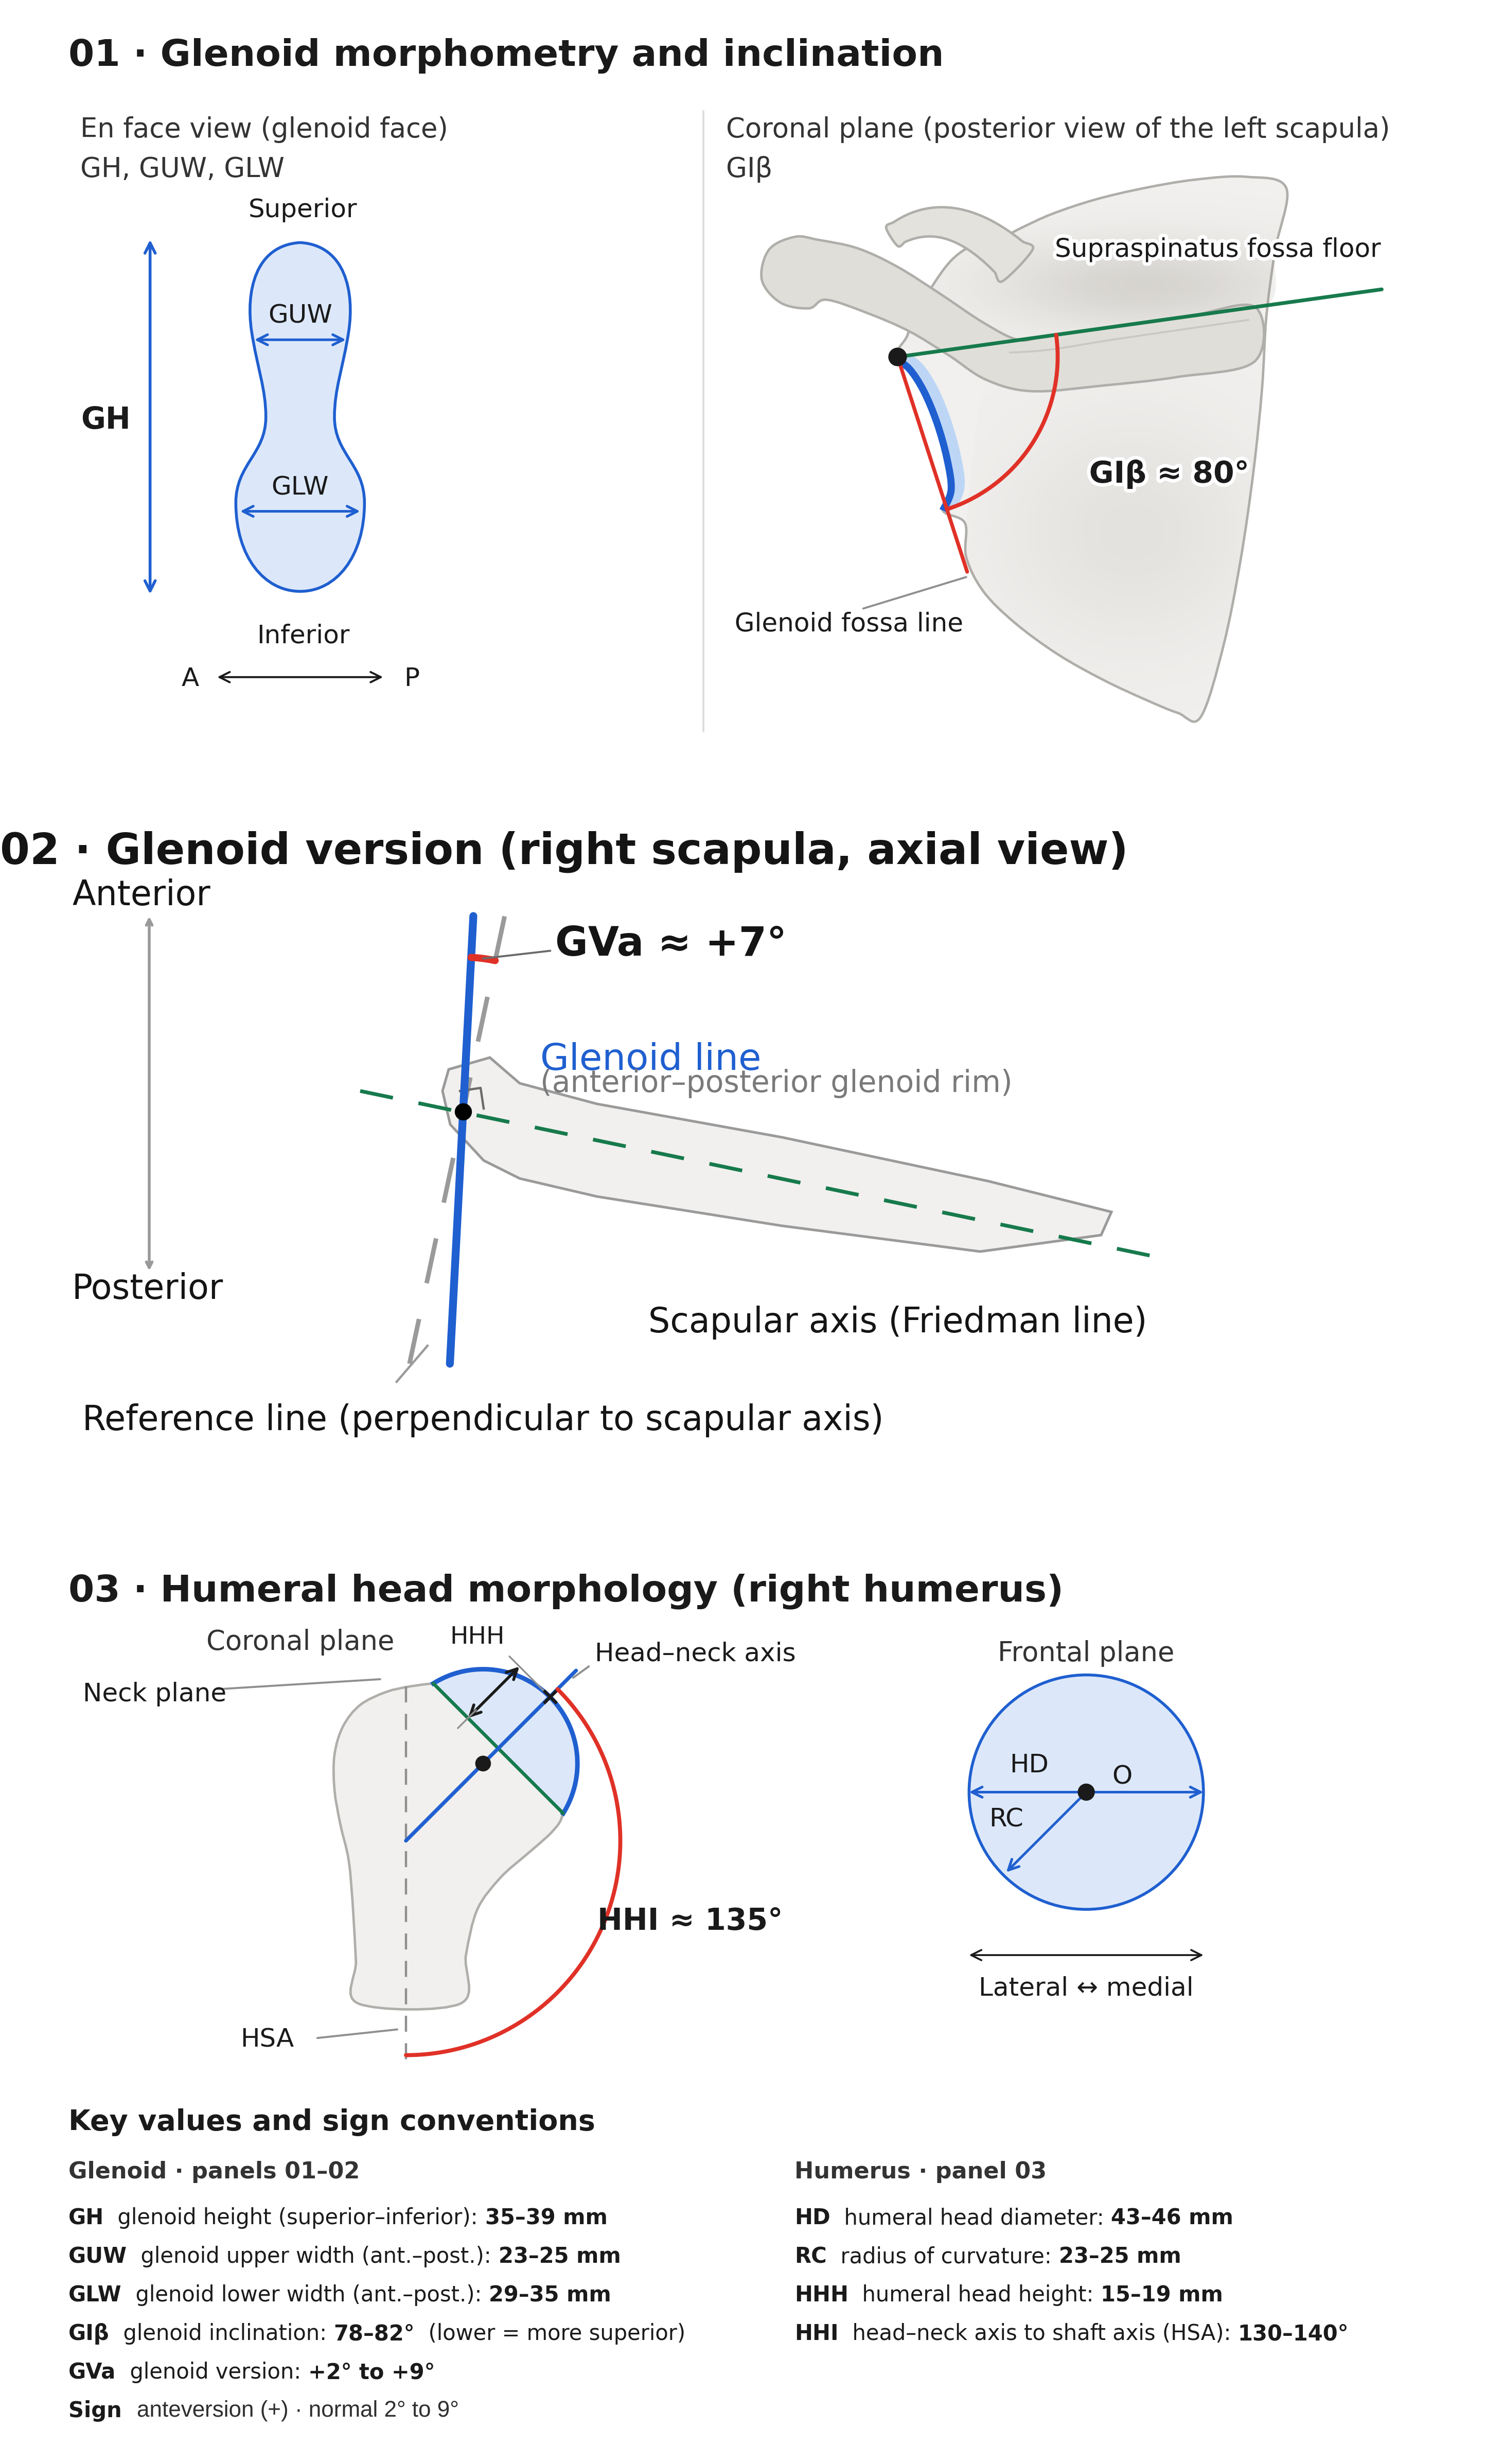
We performed digital morphometric measurements on the baseline shoulder MRI scans. For each parameter, we selected the image that best displayed the relevant landmarks and positioned digital calipers or reference lines accordingly. We recorded linear measurements in millimeters and angular measurements in degrees. The nine parameters were glenoid height (superior-to-inferior distance along the longitudinal glenoid axis on the en-face view); upper and lower glenoid width (anteroposterior distances across the upper and lower portions of the glenoid); glenoid diameter (greatest anteroposterior bony distance on the en-face view); glenoid inclination β (the angle between the glenoid fossa line and the floor of the supraspinatus fossa on an oblique coronal view); glenoid version α (the angular deviation of the anteroposterior glenoid line from a line perpendicular to the scapular/Friedman axis on an axial view, with higher values indicating greater anteversion); humeral head height (the perpendicular distance from the anatomical-neck plane to the most prominent articular surface on a coronal view); humeral head inclination (the angle between the head-neck axis and humeral shaft axis); and humeral head diameter (the maximum transverse distance through the center of the humeral head). These conventions are illustrated schematically in Figure 1; the study flow is shown separately in Figure 2.
The baseline MRI measurements were carried out without the researchers knowing each patient's subsequent instability status, and in each case the MRI scan came before the study outcome. All studies were conducted on a 3.0-T MRI scanner (GE Healthcare, Chicago, IL, USA) using a standard musculoskeletal shoulder protocol: a native 2D multiplanar acquisition was performed, without the inclusion of reconstructed views, in the axial, coronal oblique (parallel to the supraspinatus tendon), and sagittal oblique (perpendicular to the supraspinatus tendon and parallel to the glenoid face) planes. The usual sequences included T1-weighted imaging together with fat-suppressed T2 or proton-density-weighted imaging (Fat-Sat or STIR), with a standard slice thickness of 3.0 mm and an interslice gap of 0.3 mm. The native DICOM images were accessed and independently analyzed using JiveX medical imaging software (VISUS Health IT GmbH, Bochum, Germany). To ensure data independence and avoid a unit-of-analysis error, we included exactly one shoulder per patient in the final analysis; for the small subset of patients with bilateral imaging, none presented with bilateral symptoms, so we selected the single symptomatic shoulder unambiguously in every case.
Observer methodology
The MRI measurements were reviewed simultaneously by two radiologists and two orthopedic surgery residents. When disagreements occurred, the observers discussed them, and the final recorded value was decided upon by consensus. A separate interobserver or intraobserver reliability analysis was not performed.
Statistical Analysis
We performed statistical analyses in Python 3.12 using NumPy 2.4.4 and SciPy 1.17.1. Standard maximum-likelihood and Firth bias-reduced logistic regression were implemented by means of iteratively reweighted least squares, following the algorithm described by Firth[25]; this implementation was checked against scikit-learn 1.8.0 for the unpenalized case and reproduced coefficients to four decimal places. As an additional, independent validation, the primary Firth bias-reduced logistic regression model (Table 4) was separately re-fitted in R (version 4.6.1) using the logistf package (version 1.26.1)[27], with variance inflation factors computed using the car package (version 3.1-5) and the concordance statistic computed using the pROC package (version 1.19.1). Point estimates, standard errors, and profile penalized-likelihood confidence intervals were concordant with the Python implementation for all seven model terms. One transcription discrepancy was identified and corrected during this cross-validation: the profile penalized-likelihood confidence interval for humeral head inclination, originally reported as 1.00-1.13, was corrected to 1.00-1.15 to match both the Wald interval and the independently computed Python and R profile-likelihood estimates.
We compared the subsequent-instability group and the stable group on the nine morphometric measurements using two-sided independent-samples t tests (Welch's correction applied when Levene's test indicated unequal variances); as a distribution-free sensitivity analysis, Mann-Whitney U tests were carried out, and Hedges' g was used to estimate effect size. For sex and shoulder side, we used continuity-corrected chi-square tests, along with Fisher's exact test given the smaller subsequent-instability group. We applied the Benjamini-Hochberg false discovery rate to all nine morphometric comparisons.
Each morphometric measure was then evaluated in a separate logistic regression model adjusted for age, sex, and shoulder side ("demographic-adjusted screening"). The resulting nine morphometric coefficients were adjusted for multiple testing using the Benjamini-Hochberg false discovery rate. Because this demographic-adjusted screening family (Table 3) and the raw unadjusted comparisons (Table 2) test related but distinct hypotheses about the same nine parameters, each was treated as its own Benjamini-Hochberg family; a morphometric variable was carried forward into the primary multivariable model only if it reached FDR significance in both families independently, which is a more conservative criterion than either family alone and was not intended to substitute for a combined-family correction.
The primary multivariable model treated subsequent instability as a binary outcome and included age, sex, shoulder side, and the four morphometric variables that remained significant on demographic-adjusted screening after false-discovery-rate correction: glenoid height, glenoid version α, humeral head height, and humeral head inclination. This multivariable model is exploratory and hypothesis-generating: the four morphometric variables were selected from the same dataset used to estimate their effects, so the reported associations require external validation and should not be interpreted as a confirmatory or prespecified analysis. With 40 events across seven terms, the events-per-variable ratio was approximately 5.7, below the conventional benchmark of about ten for stable maximum-likelihood estimation.[24] Since both small-sample bias and quasi-separation were concerns at this events-per-variable ratio, Firth's bias-reduced penalized-likelihood logistic regression was employed as the primary method.[25][26] Standard maximum-likelihood logistic regression was also performed as a sensitivity analysis (Supplementary Table S2). Both models report odds ratios with 95% Wald confidence intervals and two-sided p values; as an alternative check on the Wald confidence intervals, 95% profile penalized-likelihood confidence intervals were also computed for the primary Firth model and are given alongside the Wald intervals in Table 4.
We used variance inflation factors, calculated from auxiliary ordinary-least-squares regressions among the seven model terms, to assess multicollinearity. We also examined correlations among the four primary morphometric variables directly. Influential observations were evaluated using leverage (hat-matrix diagonal), standardized Pearson residuals, and Cook's distance from the standard maximum-likelihood fit, with a sensitivity analysis repeating the primary model after excluding the two most influential observations. Internal model performance was assessed using the Firth model's linear predictor: the concordance (c-) statistic was calculated in the full sample ("apparent" performance), and optimism was estimated by bootstrap sampling (1,000 resamples, sampling with replacement), refitting the Firth model in each resample using the same four morphometric variables selected in the original screening step, and evaluating it both in the resample and in the original sample; the mean difference (optimism) was subtracted from the apparent c-statistic to obtain an optimism-corrected estimate. Because this procedure holds the variable-selection step fixed across resamples, it captures estimation optimism but not the additional optimism attributable to variable selection itself; as a more conservative supplementary check, we repeated the bootstrap with the full pipeline, re-running the demographic-adjusted FDR screening independently in each of the 1,000 resamples, selecting on average 3.7 of the nine morphometric parameters per resample, before refitting and evaluating the model. We also estimated a corresponding calibration slope using the same resamples for both procedures. This represents an internal, apparent-performance assessment and does not substitute for external validation, so the model is not proposed as ready for individual-patient risk prediction.
The p values are given to three decimal places, and when they would normally be shown as "P < 0.001", the exact value is instead reported to four significant figures. All tests were two-sided, and for the primary hypothesis tests α was fixed at 0.05, given that the four morphometric variables in the primary model were selected using the false-discovery-rate-corrected screening step described above.
Results
Data Validation
The analytic dataset contained 250 complete patient records with no missing values in any field and no duplicate records, and outcome coding (40 records coded "Yes" for subsequent instability, 210 coded "No") matched the cohort composition described in Methods. Continuous morphometric values fell within physiologically plausible ranges for each parameter, and no values were altered, removed, or imputed.
Sample Analysis
The final analytic cohort included 250 overhead athletes with complete demographic and morphometric data; ages ranged from 16 to 44 years (mean 30.8 ± 7.9 years). Nine athletes (3.6%; 8 male, 1 female) were aged 16-17 years at baseline; 5 of these 9 subsequently developed instability and 4 remained stable. All 250 athletes had undergone baseline shoulder MRI with no documented baseline instability. Because baseline MRIs were obtained at different points during 2020, each athlete's follow-up ran from their own baseline MRI to a common end-of-study date, giving a follow-up duration of approximately 5 years per athlete; no athlete was lost to follow-up. Forty athletes (16.0%) had a documented episode of subsequent anterior shoulder instability, and 210 athletes (84.0%) remained stable through the end of follow-up (Figure 2).
Basic Demographic and Clinical Characteristics
Patients who subsequently developed instability were significantly younger than those who remained stable (mean 25.58 ± 7.65 vs 31.77 ± 7.60 years; median 24.0 [IQR 18.0-34.0] vs 31.0 [IQR 26.0-39.0]; t test p < 0.001, Mann-Whitney U test p < 0.001). Because this age difference was both statistically significant and clinically relevant, age was retained as an adjustment covariate in every subsequent regression model, and its independent association with the outcome is reported in the multivariable analysis below. Sex (70.0% vs 62.9% male; p = 0.495) and shoulder side (45.0% vs 59.5% right-sided; p = 0.127) did not differ significantly between groups, although the numerically lower proportion of right-sided involvement among patients who developed instability did not reach significance and is discussed further below.
| Characteristic | Overall analytic cohort N = 250 | Remained stable N = 210 | Subsequent-instability cases N = 40 | p value |
|---|---|---|---|---|
| Age (years), mean ± SD | 30.78 ± 7.93 | 31.77 ± 7.60 | 25.58 ± 7.65 | <0.001 |
| Age (years), median [IQR] | 29.5 [24.0-38.0] | 31.0 [26.0-39.0] | 24.0 [18.0-34.0] | — |
| Age range (years) | 16-44 | 16-44 | 16-40 | — |
| Sex, n (%) | Male 160 (64.0%); Female 90 (36.0%) | Male 132 (62.9%); Female 78 (37.1%) | Male 28 (70.0%); Female 12 (30.0%) | 0.495 |
| Shoulder side, n (%) | Right 143 (57.2%); Left 107 (42.8%) | Right 125 (59.5%); Left 85 (40.5%) | Right 18 (45.0%); Left 22 (55.0%) | 0.127 |
Baseline Morphometric Comparisons
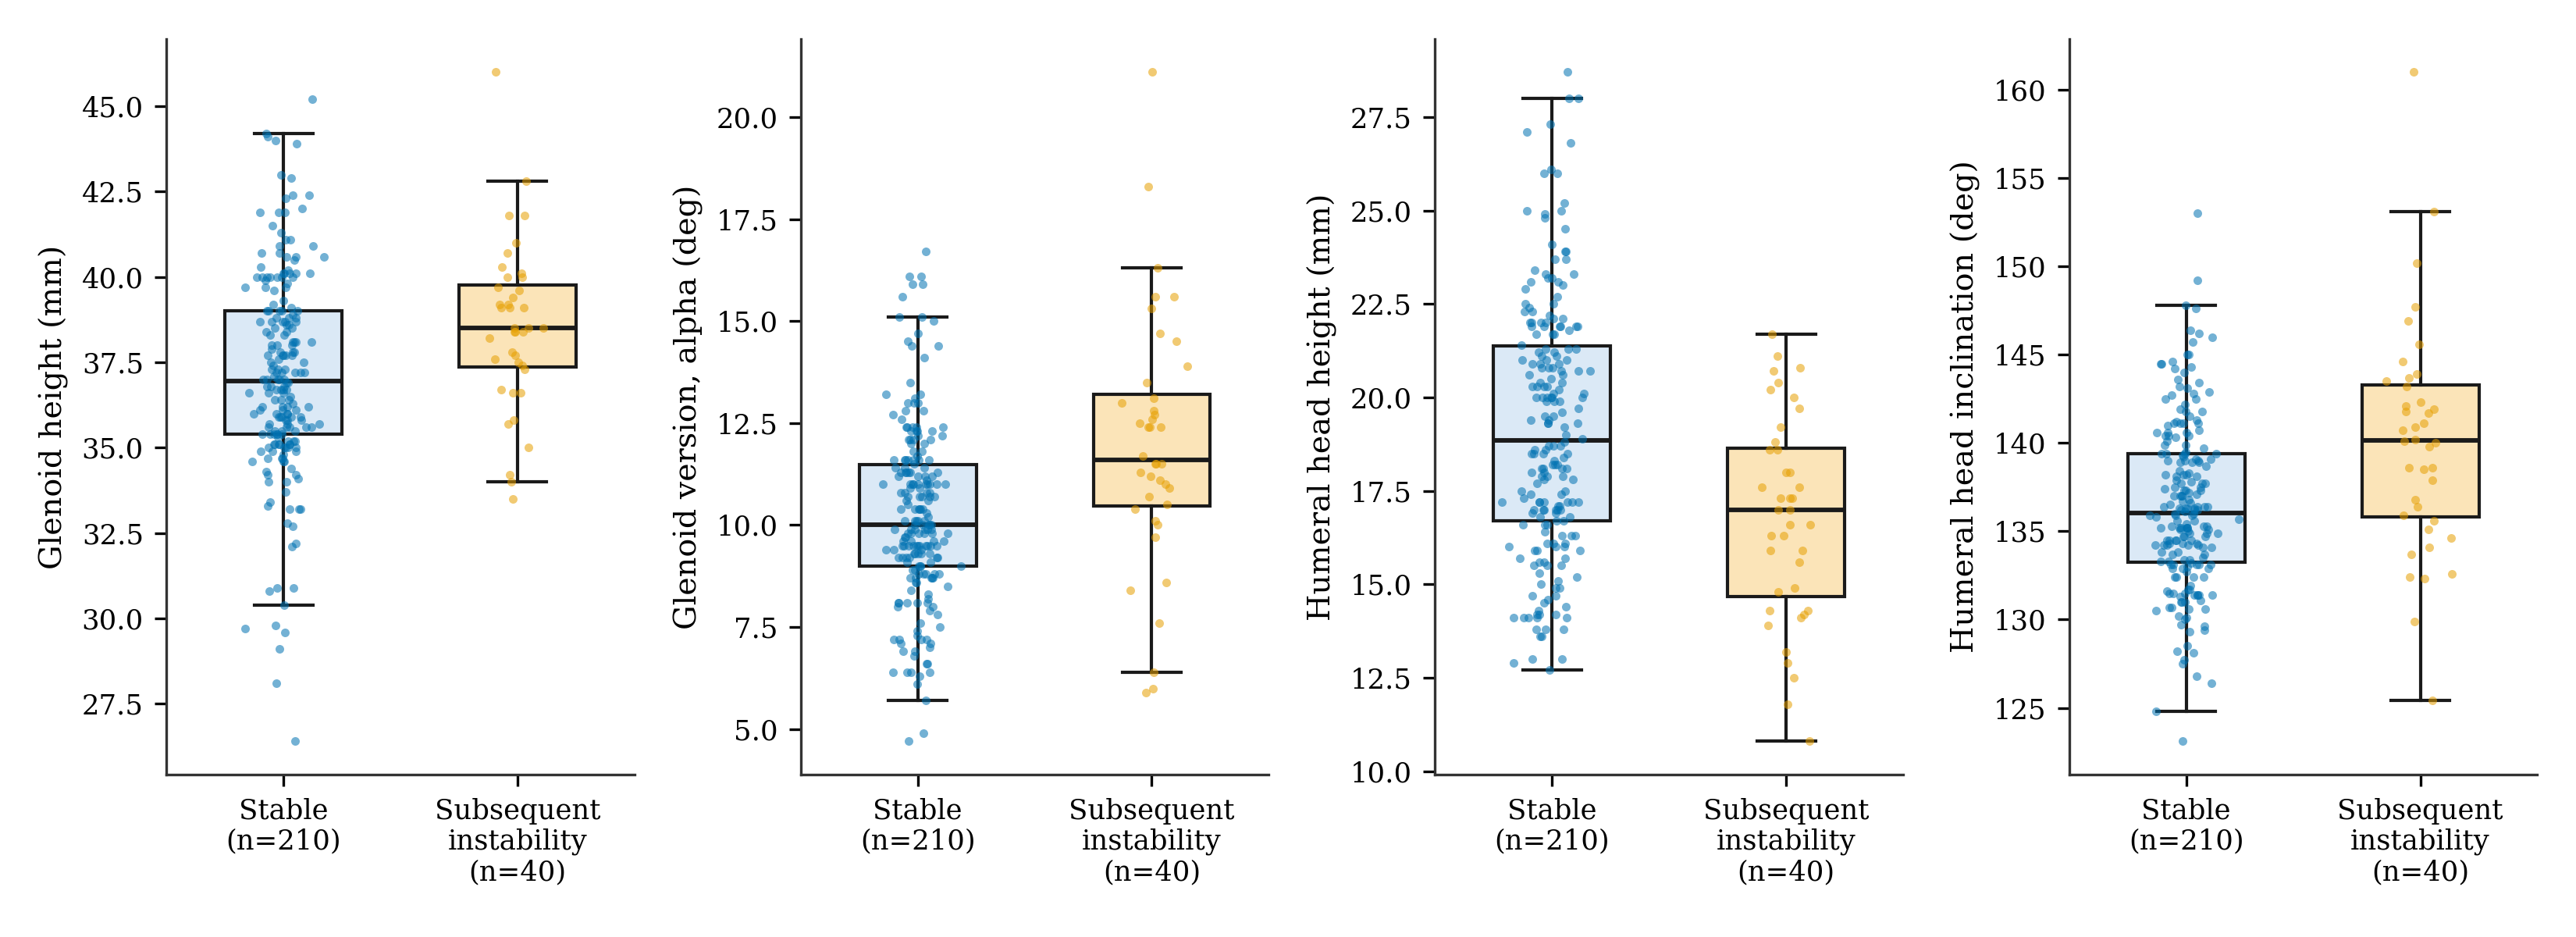
After Benjamini-Hochberg correction, four of the nine baseline measurements remained statistically significant (Table 2, Figure 3): glenoid height, glenoid version α, humeral head height, and humeral head inclination. Glenoid upper and lower width, glenoid inclination β, humeral head diameter, and glenoid diameter did not differ significantly between groups after correction.
| Parameter | Remained stable N = 210 | Subsequent-instability N = 40 | Diff. | Hedges g | Primary t-test p | FDR q |
|---|---|---|---|---|---|---|
| Glenoid height (mm) | 37.08 ± 3.04 | 38.53 ± 2.43 | +1.45 | 0.49 | 0.0047 | 0.0106 |
| Glenoid upper width (mm) | 16.30 ± 1.69 | 16.08 ± 1.49 | −0.22 | −0.13 | 0.434 | 0.693 |
| Glenoid lower width (mm) | 22.97 ± 1.54 | 22.87 ± 2.05 | −0.10 | −0.06 | 0.782 | 0.804 |
| Glenoid inclination, β angle (°) | 80.54 ± 3.52 | 81.11 ± 5.32 | +0.57 | 0.15 | 0.517 | 0.693 |
| Glenoid version, α angle (°; higher = greater anteversion) | 10.26 ± 2.20 | 11.97 ± 3.10 | +1.71 | 0.72 | 0.0017 | 0.0050 |
| Humeral head height (mm) | 19.15 ± 3.40 | 16.80 ± 2.74 | −2.35 | −0.71 | 0.0001 | 0.0002 |
| Humeral head inclination (°) | 136.43 ± 4.77 | 140.11 ± 6.47 | +3.68 | 0.72 | <0.0001 | 0.0002 |
| Humeral head diameter (mm) | 43.00 ± 2.12 | 42.67 ± 3.17 | −0.32 | −0.14 | 0.539 | 0.693 |
| Glenoid diameter (mm) | 23.70 ± 2.10 | 23.61 ± 1.64 | −0.09 | −0.04 | 0.804 | 0.804 |
Correlation and Multicollinearity of Morphometric Variables
Correlations among the four morphometric variables retained in the primary model were low to moderate, ranging from r = −0.35 (humeral head height with humeral head inclination) to r = 0.12 (glenoid version α with humeral head inclination). Variance inflation factors for all seven terms in the primary model were below 1.3, well under conventional thresholds for concerning collinearity.
Demographic-Adjusted Screening Associations
Each morphometric parameter was entered separately into a logistic regression model adjusted for age, sex, and shoulder side. After Benjamini-Hochberg correction across the nine screening models, glenoid height, glenoid version α, humeral head height, and humeral head inclination remained significant and were carried forward into the mutually adjusted primary model (Table 4). As with the primary model below, this screening step and the resulting variable selection were performed in the same dataset used to estimate the associations, so the results should be regarded as exploratory.
| Parameter | Adjusted OR (95% CI) | Adjusted p | FDR q |
|---|---|---|---|
| Glenoid height (per mm) | 1.25 (1.08-1.44) | 0.0030 | 0.0068 |
| Glenoid upper width (per mm) | 0.92 (0.73-1.17) | 0.506 | 0.650 |
| Glenoid lower width (per mm) | 0.98 (0.78-1.24) | 0.867 | 0.897 |
| Glenoid inclination, β angle (per degree) | 1.05 (0.95-1.16) | 0.348 | 0.627 |
| Glenoid version, α angle (per degree; higher = greater anteversion) | 1.25 (1.08-1.45) | 0.0028 | 0.0068 |
| Humeral head height (per mm) | 0.79 (0.69-0.90) | 0.0004 | 0.0034 |
| Humeral head inclination (per degree) | 1.11 (1.04-1.19) | 0.0028 | 0.0068 |
| Humeral head diameter (per mm) | 0.94 (0.80-1.10) | 0.421 | 0.631 |
| Glenoid diameter (per mm) | 1.01 (0.84-1.23) | 0.897 | 0.897 |
Primary Multivariable Analysis and Assessment of Overfitting
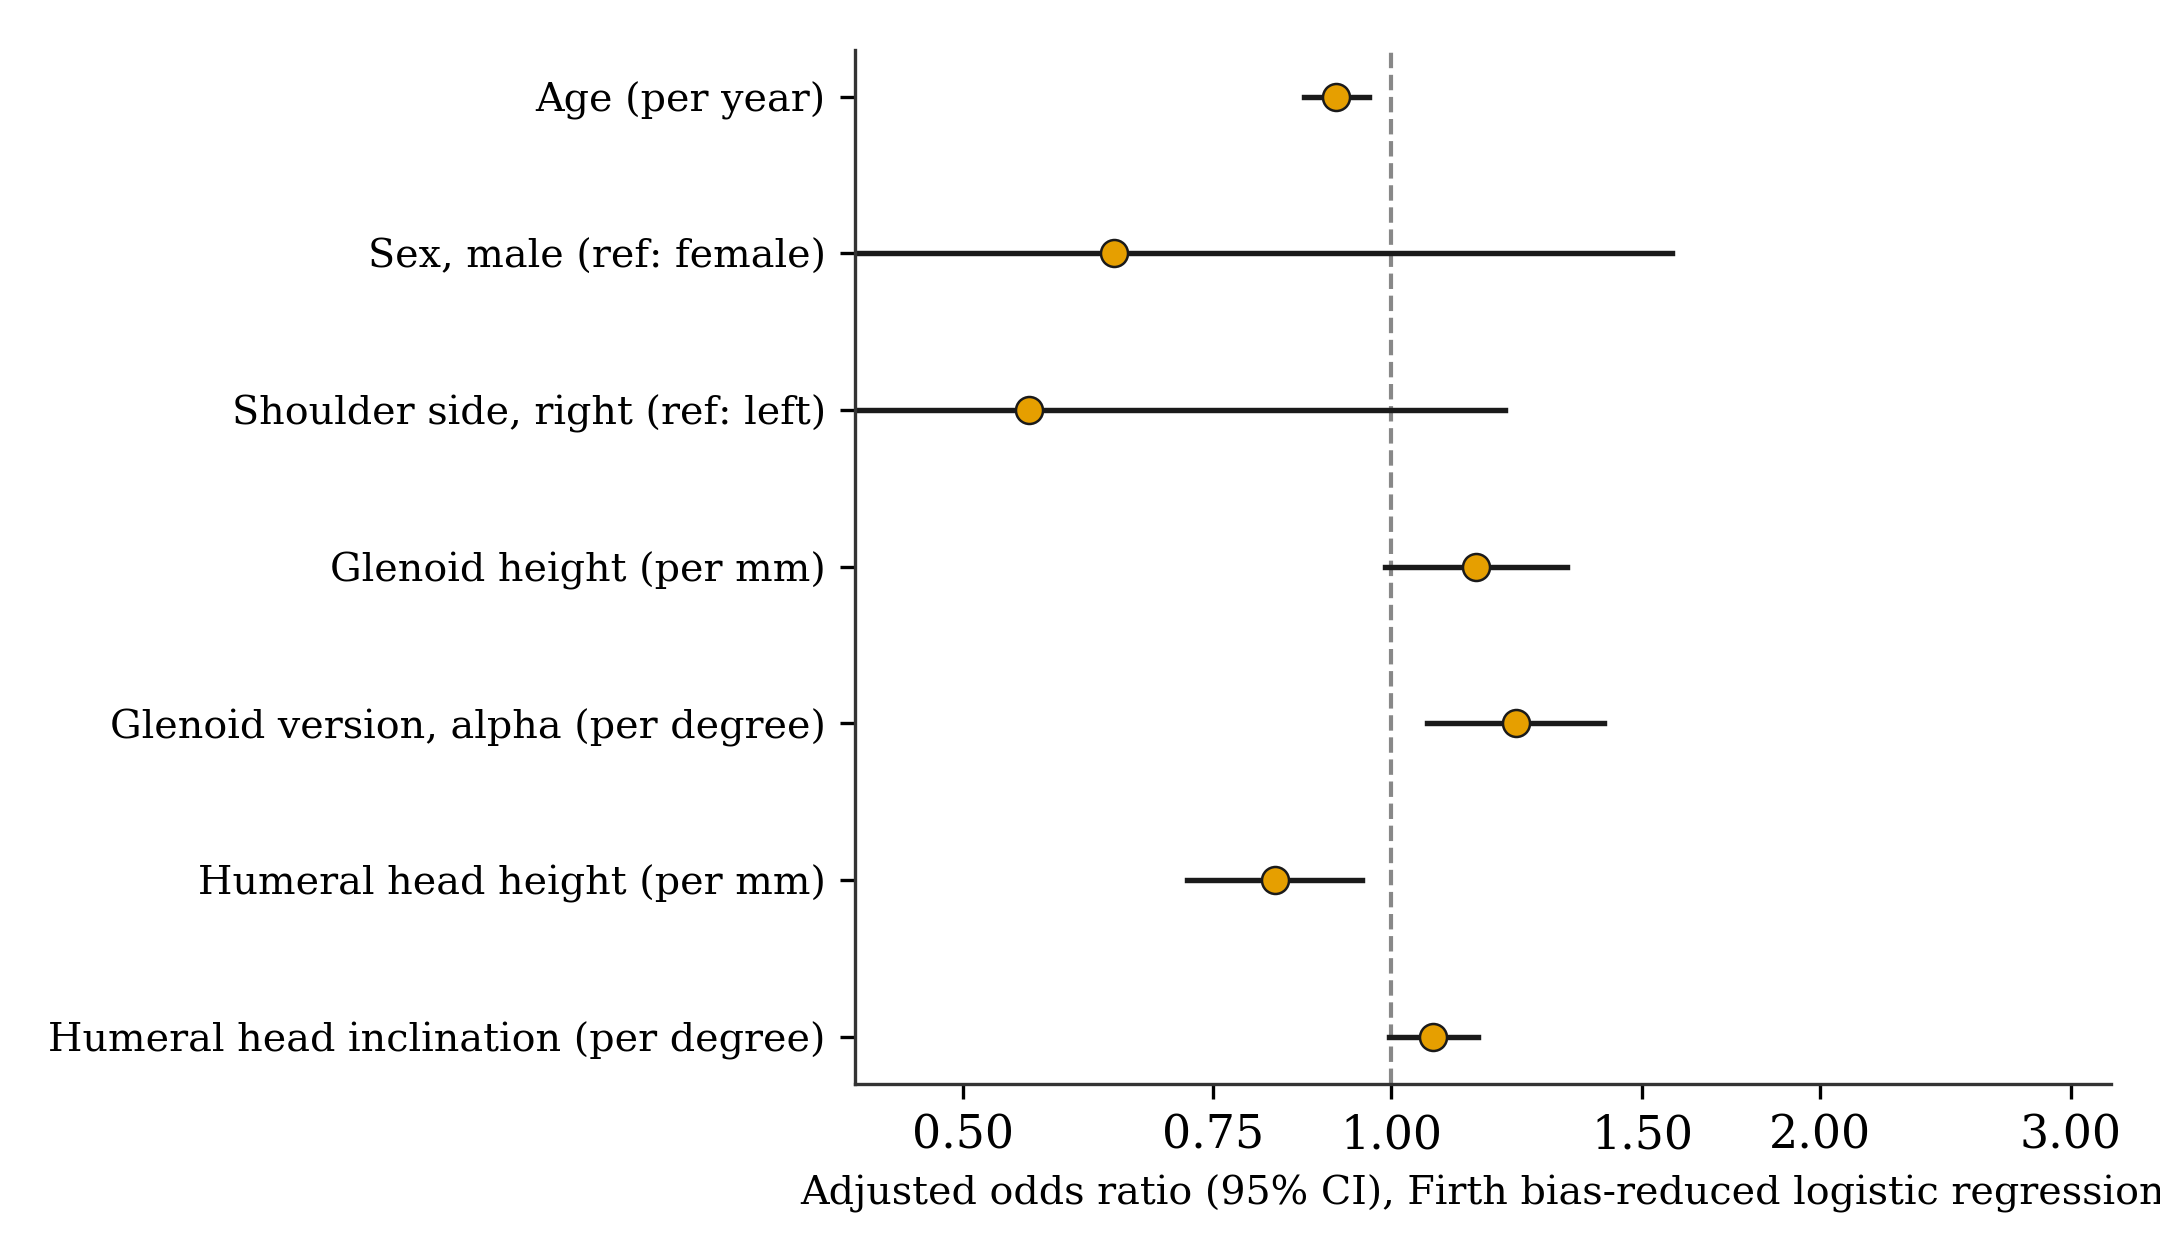
With 40 events across the seven terms of the primary model, the events-per-variable ratio was 5.7, below the conventional benchmark of about ten below which maximum-likelihood coefficients and standard errors may become less reliable.[24] We therefore used Firth's bias-reduced logistic regression as the primary analysis and report standard maximum-likelihood regression as a sensitivity comparison (Table 4, Supplementary Table S2). In the mutually adjusted model, younger age, greater glenoid version α, and lower humeral head height were independently associated with subsequent instability; glenoid height and humeral head inclination showed odds ratios in the same direction as their unadjusted associations but did not reach statistical significance after mutual adjustment (Table 4, Figure 4). Sex (aOR 0.64, 95% CI 0.26-1.57, p = 0.330) and shoulder side (aOR 0.56, 95% CI 0.26-1.20, p = 0.135) were not significantly associated with the outcome, although the point estimate for right-sided shoulders was below 1, consistent with the lower unadjusted proportion of right-sided involvement noted in Table 1. The maximum-likelihood sensitivity model produced concordant point estimates with slightly wider confidence intervals (Supplementary Table S2). Profile penalized-likelihood confidence intervals (Table 4) were closely concordant with the Wald intervals for every term, supporting the adequacy of the Wald approximation at this sample size.
| Model term | Adjusted OR | 95% Wald CI | 95% Profile CI | p value | VIF |
|---|---|---|---|---|---|
| Age (per year) | 0.92 | 0.87-0.97 | 0.87-0.96 | 0.0010 | 1.08 |
| Sex, male (ref: female) | 0.64 | 0.26-1.57 | 0.26-1.58 | 0.330 | 1.18 |
| Shoulder side, right (ref: left) | 0.56 | 0.26-1.20 | 0.26-1.19 | 0.135 | 1.02 |
| Glenoid height (per mm) | 1.15 | 0.99-1.33 | 1.00-1.34 | 0.069 | 1.19 |
| Glenoid version, α angle (per degree; higher = greater anteversion) | 1.22 | 1.06-1.41 | 1.07-1.42 | 0.0057 | 1.06 |
| Humeral head height (per mm) | 0.83 | 0.72-0.95 | 0.71-0.95 | 0.0091 | 1.18 |
| Humeral head inclination (per degree) | 1.07 | 1.00-1.15 | 1.00-1.15 | 0.062 | 1.20 |
Sensitivity Analysis for Influential Observations
The largest Cook's distance in the standard maximum-likelihood fit was 0.085, exceeding the common 4/n screening threshold (0.016) for two observations. After these two observations were excluded and the primary Firth model was refit in the remaining 248 patients, all seven model terms retained essentially the same direction of effect, and the pattern of statistical significance was materially unchanged (age aOR 0.91, p < 0.001; glenoid version α aOR 1.25, p = 0.003; humeral head height aOR 0.84, p = 0.017; glenoid height aOR 1.16, p = 0.066; humeral head inclination aOR 1.08, p = 0.058; sex aOR 0.65, p = 0.365; shoulder side aOR 0.65, p = 0.280).
Internal Validation and Assessment of Overfitting
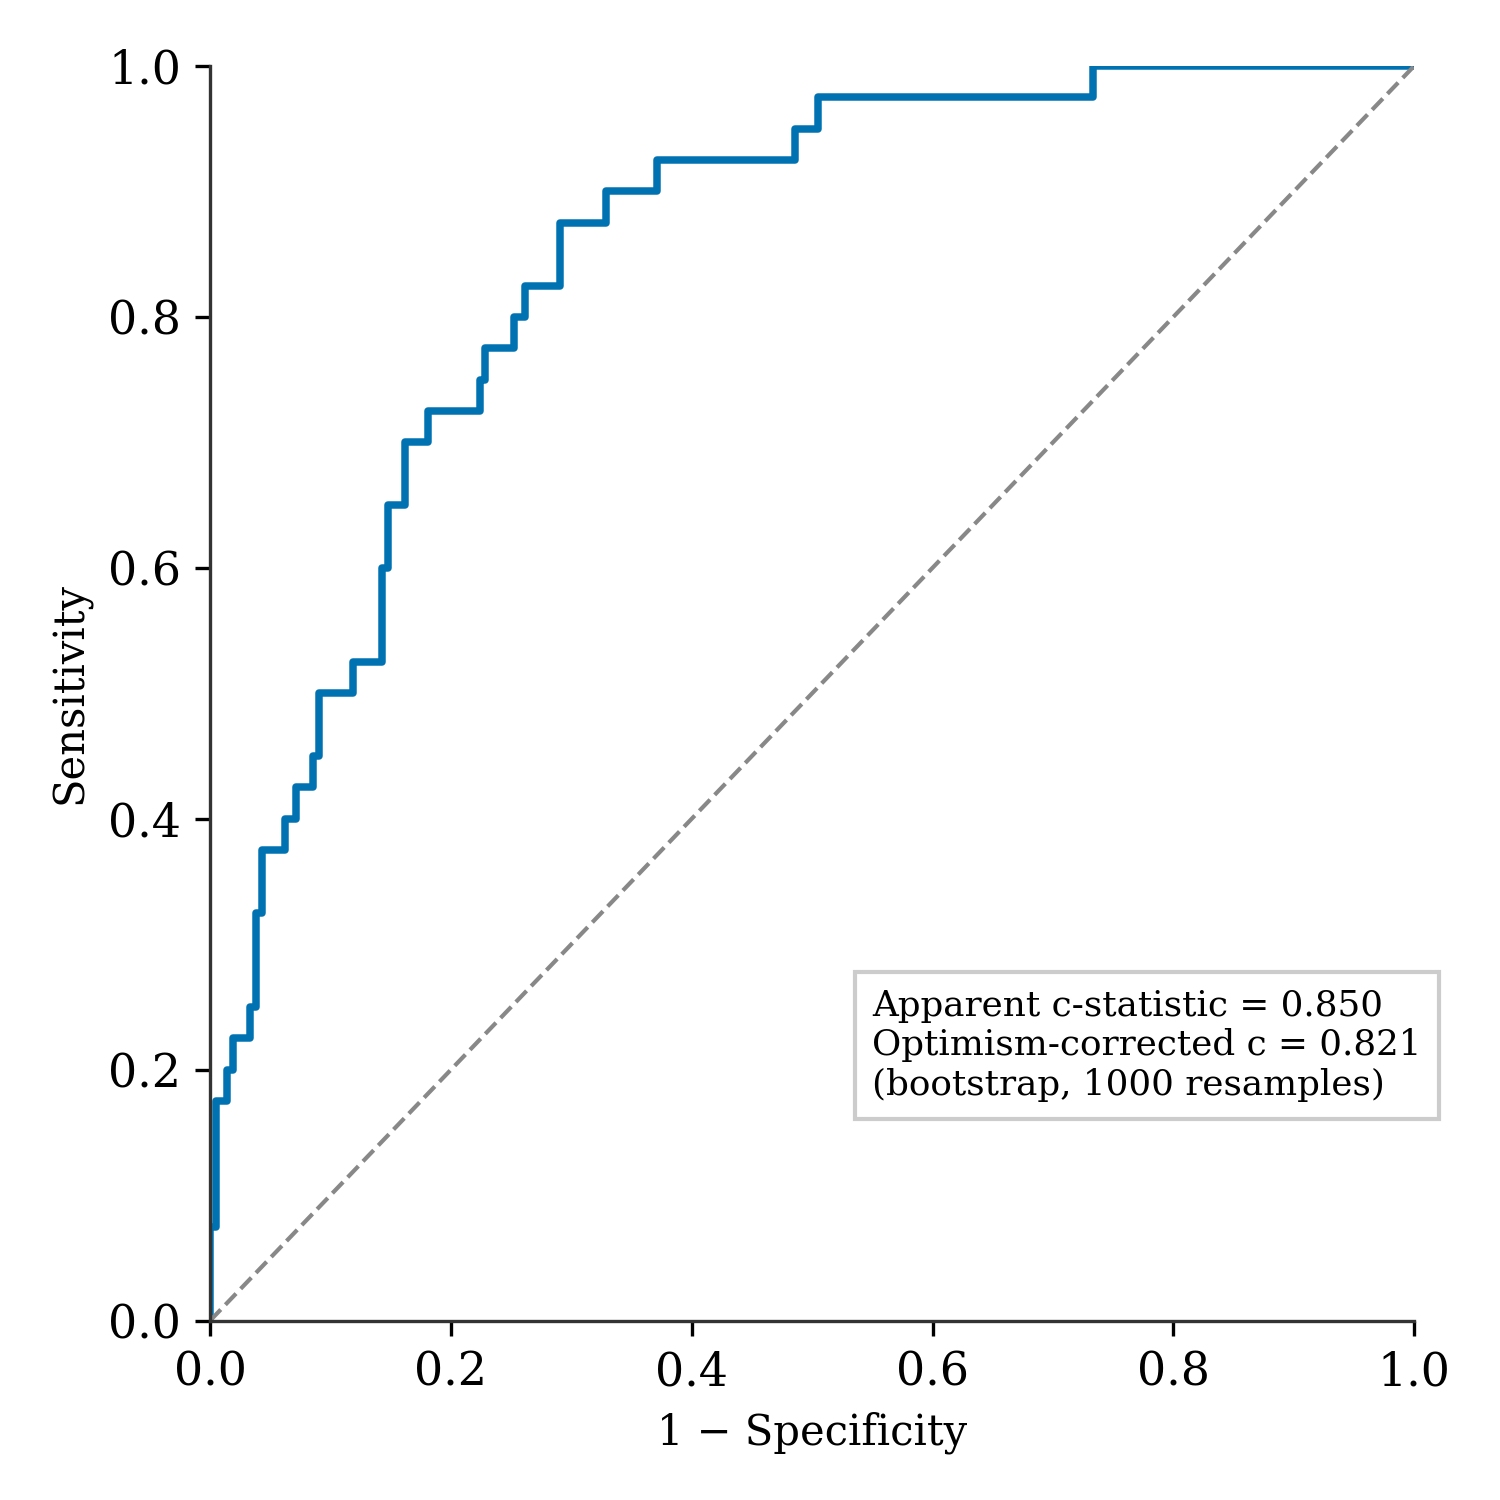
Bootstrap optimism correction with 1,000 resamples, holding the four selected morphometric variables fixed across resamples, produced an apparent c-statistic of 0.850, a mean optimism of 0.029, and an optimism-corrected c-statistic of 0.821, with a mean calibration slope of 0.91 (Figure 5). Because this fixed-selection procedure does not capture the additional optimism attributable to variable selection itself, we repeated the bootstrap with the full pipeline, re-running the demographic-adjusted FDR screening independently within each of the 1,000 resamples; this selection-aware procedure selected a mean of 3.7 of the nine morphometric parameters per resample (compared with the four selected in the original sample) and produced a more conservative optimism-corrected c-statistic of 0.805, with a mean optimism of 0.045. We report both estimates because they answer different questions: the fixed-selection estimate (0.821) reflects the performance of this specific four-variable model, while the selection-aware estimate (0.805) more fully reflects the uncertainty introduced by having chosen those four variables from the same dataset used to fit them. Both remain internal, apparent-performance estimates and do not substitute for external validation in an independent cohort.
Discussion
Principal Findings
In this retrospective cohort study, baseline MRI results differed between patients who later developed anterior shoulder instability and those who remained stable. After adjustment in a bias-reduced multivariable model, younger age, greater glenoid anteversion, and lower humeral head height were each independently linked to subsequent instability. Although glenoid height and humeral head inclination were both associated with the outcome in the unadjusted comparisons and in the demographic-adjusted analysis, their associations dropped below conventional levels of statistical significance once all seven variables were considered together, which may be due to shared variance with the other terms in the model, more modest true effect sizes, or the limited number of events available for a seven-term model. Because these four morphometric variables were selected and estimated in that same dataset, the associations reported here should be regarded as exploratory and hypothesis-generating rather than independently confirmed. A major strength of the design is that the MRI was performed before the first episode of instability; thus, the anatomical differences observed preceded the outcome and could not have been caused by it, even though temporal sequence alone does not prove causation.
The Role of Age
Unlike certain smaller morphometric cohorts, the present analysis found a clear, independent link between younger age and subsequent instability (adjusted OR 0.92 per year). This generally aligns with the broader epidemiology of anterior shoulder instability, as younger patients have higher rates of surgical stabilization and recurrence than older patients within the same under-40 population.[18] Because age was a significant unadjusted and adjusted predictor in this cohort, it was retained throughout the analysis as a covariate rather than treated only as a potential confounder; its association with the outcome should be read as a substantive finding of this study rather than a routine adjustment.
The Significance of Temporal Ordering
Images acquired after an instability episode may not dependably distinguish native anatomy from changes caused by the event itself, bone loss, or prior stabilization.[8][19] Prospective baseline imaging tackles this limitation directly: Owens and colleagues followed 714 young athletes for four years after baseline bilateral MRI and found that both the glenoid index and the coracohumeral interval were associated with subsequent instability.[17] The present study expands this general approach to a Middle Eastern population using a different set of measurements. Prospective MRI studies have also shown that glenoid bone loss can occur after both first-time and recurrent instability, suggesting that post-event joint morphology may in part reflect the outcome itself rather than only preceding susceptibility.[20]
Morphometric Findings
Lower initial humeral head height was independently linked to higher odds of becoming unstable after adjustment. This result is consistent with the general idea that the natural shape of the humeral head has an effect on glenohumeral stability, although the present dataset is not able to identify the underlying mechanism; previous studies on humeral head-to-glenoid geometry have produced conflicting results, with some reporting a smaller glenoid width or a greater glenohumeral mismatch ratio in unstable shoulders — particularly in males — and others finding no association between the innate humeral-to-glenoid size ratio and instability risk.[12,13] A greater glenoid anteversion, as indicated by a higher α angle, was independently linked to later instability, consistent with previous reports describing anteriorly unstable shoulders as less retroverted or more anteverted than controls.[9][21] A 2026 recurrence study similarly found greater retroversion to be protective against recurrence.[22] Glenoid height showed a strong unadjusted association (the largest Hedges' g among the glenoid parameters) and remained directionally consistent, though not statistically significant, after mutual adjustment; glenoid proportions such as height-to-width ratio have previously been linked with instability,[11][17] and biomechanical work shows that glenoid concavity and congruence contribute to joint stability.[4][6] Humeral head inclination followed the same pattern: a significant unadjusted association that did not retain significance after mutual adjustment. Because this parameter has rarely been measured before a first instability event, both the unadjusted and adjusted findings require confirmation in an independent cohort. Nevertheless, comparisons across studies require caution because of differences in imaging technique, population characteristics, outcome definition, and study design.
Other Morphological Metrics
Glenoid width, glenoid inclination β, humeral head diameter, and glenoid diameter did not differ significantly between groups after FDR correction, either unadjusted or after adjustment for age, sex, and shoulder side. These negative findings are reported intentionally: they indicate that the association with subsequent instability in this cohort was concentrated in glenoid height, glenoid version, and humeral head geometry, together with patient age, rather than in overall shoulder or glenoid size.
Plausibility of the Observed 16% Cumulative Incidence
Forty of 250 overhead athletes (16.0%) had a documented anterior instability event over approximately 5 years of follow-up, with enrollment staggered across 2020 to a common end-of-study date and no loss to follow-up in this cohort. Because this cohort was restricted to overhead athletes referred for persistent shoulder pain, this cumulative incidence is specific to that referral population and should not be extrapolated to non-athletic populations, asymptomatic overhead athletes, or athletes evaluated for other indications.
Clinical Interpretation
While these data identify potential morphometric and demographic factors that indicate susceptibility, they cannot currently be used to predict individual outcomes. The fact that the study is based on a single center means that it does not allow for the establishment of practical clinical thresholds relying solely on morphometric measurements, and shoulder side, despite a numerically lower proportion of right-sided involvement among patients who developed instability, was not found to be independently related to the outcome in the adjusted model. Because the cohort included athletes referred for persistent shoulder pain, these associations should be interpreted in that context and should not be assumed to apply to asymptomatic overhead athletes or to athletes referred for other reasons.
Strengths
A major strength of the study is the timing of the imaging: all baseline MRI scans were obtained before any documented instability event, so a later event could not have caused the anatomy recorded at baseline. Morphometric assessors were also unaware of later outcome status, and we applied the same measurement protocol and four-assessor consensus procedure to all patients. The Middle Eastern overhead-athlete population also addresses an underrepresented setting in this area of research. We assessed collinearity among the primary model terms, examined influential observations directly, and used a bias-reduced estimator appropriate to the limited number of events, with bootstrap-based internal validation of model performance under both a fixed-selection and a selection-aware procedure.
Limitations
Several limitations deserve mention. This was a single-center retrospective cohort study, so residual confounding and incomplete documentation remain possible; unmeasured factors such as training volume within each sport, hand dominance, and the specific trauma mechanism of each instability event were not available and could not be adjusted for. Individual enrollment and outcome dates were not retained in the extracted analytic dataset, so follow-up duration is reported only as an approximate, cohort-level figure (enrollment staggered across 2020 to a common end-of-study date) rather than as an exact median and range per athlete; we cannot rule out that follow-up duration varied in a way that was itself associated with the outcome. The case cohort combined both traumatic and atraumatic episodes of anterior instability rather than isolating a single inciting mechanism; because our primary interest was the bone morphology associated with anterior instability itself, this mixed etiology was not further stratified, and the reported associations should be interpreted as pertaining to anterior instability broadly rather than to either mechanism specifically. The ethics-approval and consent details were not included in the materials supplied for this analysis and are marked for author verification throughout the manuscript; until confirmed, the ethical basis for this study cannot be fully documented. A separate interobserver or intraobserver measurement reliability analysis was not performed; measurements were instead established by contemporaneous four-assessor consensus, and some residual measurement error is possible that could attenuate true associations. Most importantly, the seven-term multivariable model was based on only 40 events—5.7 events per variable, below the conventional benchmark of about ten.[24] We addressed this limitation by using Firth's bias-reduced logistic regression as the primary estimator because it is less prone to small-sample bias and quasi-separation than standard maximum-likelihood estimation under a low events-per-variable ratio.[25][26] Nevertheless, because the four morphometric terms were selected in the same dataset used to estimate their effects, the model remains exploratory pending independent validation; the internal c-statistic and calibration slope reported here are apparent, in-sample estimates rather than externally validated performance measures, and even the more conservative, selection-aware optimism-corrected c-statistic (0.805) should not be interpreted as validated discriminative performance. Finally, because this cohort was assembled from a single referral indication (persistent shoulder pain) at a single center, the observed 16.0% cumulative incidence and the morphometric associations reported here should be regarded as applying to this specific referral population and may not generalize to asymptomatic overhead athletes, athletes evaluated for other indications, or other centers.
Future Directions
In future work, a dedicated interobserver and intraobserver reliability substudy should be considered if formal reliability estimates are required, and external validation of the four-variable morphometric model, together with the independent age association identified here, should be pursued in an independent cohort — ideally including asymptomatic athletes and athletes evaluated for other clinical indications — before any consideration of clinical use.[23]
Conclusion
In this cohort of 250 overhead athletes with baseline shoulder MRI and no documented history of instability, 40 athletes (16.0%) subsequently developed anterior shoulder instability over approximately 5 years of follow-up to a common end-of-study date. Younger age, greater glenoid anteversion, and lower humeral head height were independently associated with subsequent instability in a bias-reduced multivariable model; glenoid height and humeral head inclination were associated with the outcome in unadjusted and demographic-adjusted analyses but were attenuated after mutual adjustment. Because MRI was obtained before the first instability episode, the anatomical differences preceded the outcome; however, this temporal ordering does not establish causality, and because the four morphometric variables were selected in the same dataset used to estimate their effects, these associations remain exploratory and require external validation before they can be used clinically.
Declarations
Funding: None.
Conflicts of interest: The authors declare no conflicts of interest.
Data availability: The de-identified dataset underlying this study is available from the corresponding author upon reasonable request.
Author contributions: Antoine Mezher contributed to methodology, investigation, data compilation, formal analysis, and preparation of the first draft. Joseph Maalouly supported the investigation through validation, provided resources, reviewed and edited the manuscript, and supervised the study. George El Rassi led the conceptualization and methodology, provided resources, reviewed and edited the manuscript, supervised the study, and administered the project. All authors reviewed and approved the final manuscript.
References
- Olds M, Ellis R, Donaldson K, Parmar P, Kersten P. Risk factors which predispose first-time traumatic anterior shoulder dislocations to recurrent instability in adults: a systematic review and meta-analysis. Br J Sports Med. 2015;49(14):913–922. https://doi.org/10.1136/bjsports-2014-094342
- Zacchilli MA, Owens BD. Epidemiology of shoulder dislocations presenting to emergency departments in the United States. J Bone Joint Surg Am. 2010;92(3):542–549. https://doi.org/10.2106/JBJS.I.00450
- Itoi E. 'On-track' and 'off-track' shoulder lesions. EFORT Open Rev. 2017;2(8):343–351. https://doi.org/10.1302/2058-5241.2.170007
- Lippitt SB, Vanderhooft JE, Harris SL, Sidles JA, Harryman DT II, Matsen FA III. Glenohumeral stability from concavity-compression: a quantitative analysis. J Shoulder Elbow Surg. 1993;2(1):27–35. https://doi.org/10.1016/S1058-2746(09)80134-1
- Moroder P, Ernstbrunner L, Pomwenger W, Oberhauser F, Hitzl W, Tauber M, Resch H, Moroder R. Anterior shoulder instability is associated with an underlying deficiency of the bony glenoid concavity. Arthroscopy. 2015;31(7):1223–1231. https://doi.org/10.1016/j.arthro.2015.02.009
- Ernstbrunner L, Werthel JD, Hatta T, Thoreson A, Resch H, An KN, Moroder P. Biomechanical analysis of the effect of congruence, depth and radius on the stability ratio of a simplistic 'ball-and-socket' joint model. Bone Joint Res. 2016;5(10):453–460. https://doi.org/10.1302/2046-3758.510.BJR-2016-0078.R1
- Halder AM, Kuhl SG, Zobitz ME, Larson D, An KN. Effects of the glenoid labrum and glenohumeral abduction on stability of the shoulder joint through concavity-compression: an in vitro study. J Bone Joint Surg Am. 2001;83(7):1062–1069. https://doi.org/10.2106/00004623-200107000-00013
- Peltz CD, Zauel R, Ramo N, Mehran N, Moutzouros V, Bey MJ. Differences in glenohumeral joint morphology between patients with anterior shoulder instability and healthy, uninjured volunteers. J Shoulder Elbow Surg. 2015;24(7):1014–1020. https://doi.org/10.1016/j.jse.2015.03.024
- Hohmann E, Tetsworth K. Glenoid version and inclination are risk factors for anterior shoulder dislocation. J Shoulder Elbow Surg. 2015;24(8):1268–1273. https://doi.org/10.1016/j.jse.2015.03.032
- Hong J, Huang Y, Ma C, Qu G, Meng J, Wu H, Shi M, Wang Y, Zhou C, Chen Z, Yan S, Wang W. Risk factors for anterior shoulder instability: a matched case-control study. J Shoulder Elbow Surg. 2019;28(5):869–874. https://doi.org/10.1016/j.jse.2018.09.014
- Kıvrak A, Ulusoy İ. Effect of glenohumeral joint bone morphology on anterior shoulder instability: a case-control study. J Clin Med. 2023;12(15):4910. https://doi.org/10.3390/jcm12154910
- Willigenburg NW, Bouma RA, Scholtes VAB, van der Hulst VPM, van Deurzen DFP, van den Bekerom MPJ. Does the innate relative size of the humeral head and glenoid affect the risk of anterior shoulder instability? Shoulder Elbow. 2019;11(6):424–429. https://doi.org/10.1177/1758573218805099
- Cohn MR, DeFroda SF, Huddleston HP, Williams BT, Singh H, Vadhera A, Garrigues GE, Nicholson GP, Yanke AB, Verma NN. Does native glenoid anatomy predispose to shoulder instability? An MRI analysis. J Shoulder Elbow Surg. 2022;31(6S):S110–S116. https://doi.org/10.1016/j.jse.2022.03.002
- Merrill A, Guzman K, Miller SL. Gender differences in glenoid anatomy: an anatomic study. Surg Radiol Anat. 2009;31(3):183–189. https://doi.org/10.1007/s00276-008-0425-3
- Suroto H, Licindo D, Wibowo PA, Gultom GRR, Aprilya D, Setiawati R, Samijo S. Morphology of humeral head and glenoid in normal shoulder of Indonesian population. Orthop Res Rev. 2022;14:459–469. https://doi.org/10.2147/ORR.S378658
- Maalouly J, Tawk A, Aouad D, Abdel Nour H, Saidy E, Abboud G, El Rassi G. Is there an association between glenoid parameters and rotator cuff tears and the influence of gender: a retrospective study on a Middle Eastern population. Int J Surg Case Rep. 2020;68:74–82. https://doi.org/10.1016/j.ijscr.2020.02.035
- Owens BD, Campbell SE, Cameron KL. Risk factors for anterior glenohumeral instability. Am J Sports Med. 2014;42(11):2591–2596. https://doi.org/10.1177/0363546514551149
- Leland DP, Bernard CD, Keyt LK, Krych AJ, Dahm DL, Sanchez-Sotelo J, Camp CL. An Age-Based Approach to Anterior Shoulder Instability in Patients Under 40 Years Old: Analysis of a US Population. Am J Sports Med. 2020;48(1):56–62. https://doi.org/10.1177/0363546519886861
- Niu Z, Shen X, Li M, Fan M, Zuo J, Liu T. Comparison of Glenohumeral Bone Morphology Between Patients With Versus Without Anterior Shoulder Instability. Orthop J Sports Med. 2023;11(12):23259671231217971. https://doi.org/10.1177/23259671231217971
- Dickens JF, Slaven SE, Cameron KL, Pickett AM, Posner M, Campbell SE, Owens BD. Prospective Evaluation of Glenoid Bone Loss After First-time and Recurrent Anterior Glenohumeral Instability Events. Am J Sports Med. 2019;47(5):1082–1089. https://doi.org/10.1177/0363546519831286
- Aygün Ü, Çalik Y, Işik C, Şahin H, Şahin R, Öktem Aygün D. The importance of glenoid version in patients with anterior dislocation of the shoulder. J Shoulder Elbow Surg. 2016;25(12):1930–1936. https://doi.org/10.1016/j.jse.2016.09.018
- Wollner G, Cik C, Luisi S, Anderl L, Pengg F, Koenig FRM, Hajdu S, Bach C, Hruska F. Glenoid retroversion as a protective factor against recurrent anterior shoulder instability following first-time traumatic dislocation: a retrospective analysis. J ISAKOS. 2026;19:101145. https://doi.org/10.1016/j.jisako.2026.101145
- Milano G, Grasso A, Russo A, Magarelli N, Santagada DA, Deriu L, Baudi P, Bonomo L, Fabbriciani C. Analysis of Risk Factors for Glenoid Bone Defect in Anterior Shoulder Instability. Am J Sports Med. 2011;39(9):1870–1876. https://doi.org/10.1177/0363546511411699
- Peduzzi P, Concato J, Kemper E, Holford TR, Feinstein AR. A simulation study of the number of events per variable in logistic regression analysis. J Clin Epidemiol. 1996;49(12):1373–1379. https://doi.org/10.1016/s0895-4356(96)00236-3
- Firth D. Bias reduction of maximum likelihood estimates. Biometrika. 1993;80(1):27–38. https://doi.org/10.1093/biomet/80.1.27
- Heinze G, Schemper M. A solution to the problem of separation in logistic regression. Stat Med. 2002;21(16):2409–2419. https://doi.org/10.1002/sim.1047
- Heinze G, Ploner M, Dunkler D, Southworth H. logistf: Firth's Bias-Reduced Logistic Regression. R package. https://cran.r-project.org/package=logistf
Supplementary Material
| Model term | Firth aOR (95% CI) | Firth p | Standard MLE aOR (95% CI) | Standard MLE p |
|---|---|---|---|---|
| Age (per year) | 0.92 (0.87-0.97) | 0.001 | 0.91 (0.86-0.96) | 0.001 |
| Sex, male (ref: female) | 0.64 (0.26-1.57) | 0.330 | 0.62 (0.24-1.57) | 0.312 |
| Shoulder side, right (ref: left) | 0.56 (0.26-1.20) | 0.135 | 0.54 (0.25-1.19) | 0.128 |
| Glenoid height (per mm) | 1.15 (0.99-1.33) | 0.069 | 1.16 (0.99-1.35) | 0.059 |
| Glenoid version, α angle (per degree) | 1.22 (1.06-1.41) | 0.006 | 1.24 (1.07-1.43) | 0.004 |
| Humeral head height (per mm) | 0.83 (0.72-0.95) | 0.009 | 0.82 (0.71-0.95) | 0.008 |
| Humeral head inclination (per degree) | 1.07 (1.00-1.15) | 0.062 | 1.08 (1.00-1.16) | 0.053 |
| Item | STROBE item | Reported in |
|---|---|---|
| Title and abstract (1a, 1b) | Indicate study design in title/abstract; provide informative summary | Title; Abstract (Study design, Methods, Data summary, Conclusion) |
| Background/rationale (2) | Explain scientific background and rationale | Introduction, paragraphs 1–3 |
| Objectives (3) | State specific objectives, including hypotheses | Introduction, final paragraph |
| Study design (4) | Present key elements of study design early | Article Information (Study design); Methods 2.1 |
| Setting (5) | Describe setting, locations, dates of recruitment/follow-up | Methods 2.1–2.2 (St. George's University Medical Center, Beirut; baseline MRI enrollment staggered across 2020; common end-of-study date, ~5 years of follow-up per athlete) |
| Participants (6a, 6b) | Eligibility criteria, sources, methods of selection; matching criteria if applicable | Methods 2.2 (Patient Identification and Eligibility) |
| Variables (7) | Define outcomes, exposures, predictors, confounders, effect modifiers | Methods 2.3 (outcome definition); Methods 2.4 (morphometric predictors); Methods 2.5 (age, sex, shoulder side as covariates) |
| Data sources/measurement (8) | For each variable, sources of data and details of assessment methods | Methods 2.3 (EMR-based outcome ascertainment); Methods 2.4 (MRI protocol and morphometric measurement); Observer methodology |
| Bias (9) | Describe efforts to address potential sources of bias | Methods 2.4 (blinded measurement); Methods 2.3 (blinded outcome verification); Discussion, Limitations (residual confounding, referral-population bias, single symptomatic shoulder per patient) |
| Study size (10) | Explain how study size was arrived at | Methods 2.2 (consecutive series of 280 screened, 250 eligible); this was a consecutive-series cohort rather than a pre-specified target sample size, and no formal power calculation was performed — noted as a limitation |
| Quantitative variables (11) | Explain how quantitative variables were handled; groupings chosen | Methods 2.5 (continuous predictors modeled per unit; no categorization) |
| Statistical methods (12a–12e) | Methods for confounder control, subgroups/interactions, missing data, loss to follow-up, sensitivity analyses | Methods 2.5 in full; Results 3.5–3.9 (correlation/VIF, influential-observation sensitivity, bootstrap validation); no missing data or loss to follow-up occurred (Results 3.1–3.2) |
| Participants (13a–13c) | Numbers at each stage; reasons for non-participation; flow diagram | Figure 2 (280 screened → 30 excluded, with reasons → 250 analyzed → 40/210 outcome split) |
| Descriptive data (14a–14c) | Characteristics of participants and exposures; number with missing data; follow-up time | Table 1; Results 3.1–3.2 (no missing data); approximately 5-year follow-up per athlete to a common end-of-study date, with no loss to follow-up; exact median/range of follow-up duration not available and disclosed as a limitation (Discussion, Limitations) |
| Outcome data (15) | Number of outcome events over time | Results 3.2; Figure 2 (40 events / 250 over approximately 5 years of follow-up) |
| Main results (16a–16c) | Unadjusted and adjusted estimates with precision; confounders adjusted for; category boundaries; absolute risk where relevant | Tables 2–4; Figure 4; Results 3.4, 3.6–3.7 |
| Other analyses (17) | Other analyses done (subgroups, interactions, sensitivity analyses) | Results 3.5 (collinearity), 3.8 (influential-observation sensitivity), 3.9 (bootstrap internal validation, fixed-selection and selection-aware variants); Supplementary Table S2 (standard MLE sensitivity model) |
| Key results (18) | Summarize key results with reference to objectives | Discussion, Principal Findings |
| Limitations (19) | Discuss limitations, sources of bias/imprecision, direction and magnitude of bias | Discussion, Limitations |
| Interpretation (20) | Cautious overall interpretation considering objectives, limitations, multiplicity, similar studies | Discussion, Principal Findings; Clinical Interpretation; Plausibility of the Observed 16% Cumulative Incidence |
| Generalisability (21) | Discuss external validity | Discussion, Plausibility of the Observed 16% Cumulative Incidence; Limitations (single-center, single-referral-indication population) |
| Funding (22) | Source of funding and role of funders | Declarations, Funding |